
Viking Therapeutics (VKTX) After Wider Losses Is The Valuation Risk Already Priced In
Viking Therapeutics (VKTX) is back in focus after its latest quarterly report showed a wider net loss, a development that immediately reframed how traders and longer term investors assess the biotech’s risk profile.
Viking Therapeutics has seen brisk trading around the earnings release, with a 7 day share price return of 12.68% partially offsetting a 30 day share price decline of 8.88% and a 90 day drop of 17.18%. Investors are reassessing the wider losses against a 3 year total shareholder return of 162.06% and a 5 year total shareholder return of 315.85%, indicating that long term holders remain on very large gains even as recent momentum has cooled.
Spot fresh biotech setups by comparing Viking Therapeutics with a curated 33 healthcare AI stocks that have been moving sharply around clinical and earnings catalysts.Bulls point to Viking Therapeutics’ long run of shareholder gains and pipeline potential, while bears focus on the widening losses and recent share pullback. Which story do the current valuation markers lean toward?
Preferred Price-to-Book Multiple of 5.9x: Is It Justified for Viking Therapeutics?
On recent numbers, Viking Therapeutics trades on a P/B ratio of 5.9x compared with an industry average of 1.8x and a peer average of 3.6x. With the last close at $27.28, the current valuation embeds a materially richer multiple than many US biotech stocks that are also loss making.
The P/B multiple compares the market value of the equity to the accounting value of net assets. For a clinical stage biotech with no revenue and a reported net loss of $627.195m, investors are effectively paying well above book value for the existing drug pipeline, future trial outcomes, and potential commercialisation rather than current earnings power.
That premium suggests the market is placing a high implied value on Viking Therapeutics' metabolic and endocrine pipeline, even though the firm is currently unprofitable and forecast to remain loss making over the next 3 years. When the sector average sits at 1.8x and the peer group at 3.6x, a 5.9x P/B ratio looks expensive in straight comparative terms, especially given the business reports no revenue at present.
See what the numbers say about this price — find out in our valuation breakdown.
Result: Price-to-book of 5.9x (OVERVALUED)
Still, the story around Viking Therapeutics can change quickly if key clinical trials disappoint, or if funding conditions tighten and make fresh capital more expensive.
Find out about the key risks to this Viking Therapeutics narrative.
Another View: SWS DCF Model Paints A Very Different Picture
The P/B snapshot makes Viking Therapeutics look expensive, and the SWS DCF model goes even further and indicates the stock may be heavily overvalued. With our estimate of future cash flow value at $3.28 versus a $27.28 share price, the gap points to substantial valuation risk if optimism fades.
Look into how the SWS DCF model arrives at its fair value.
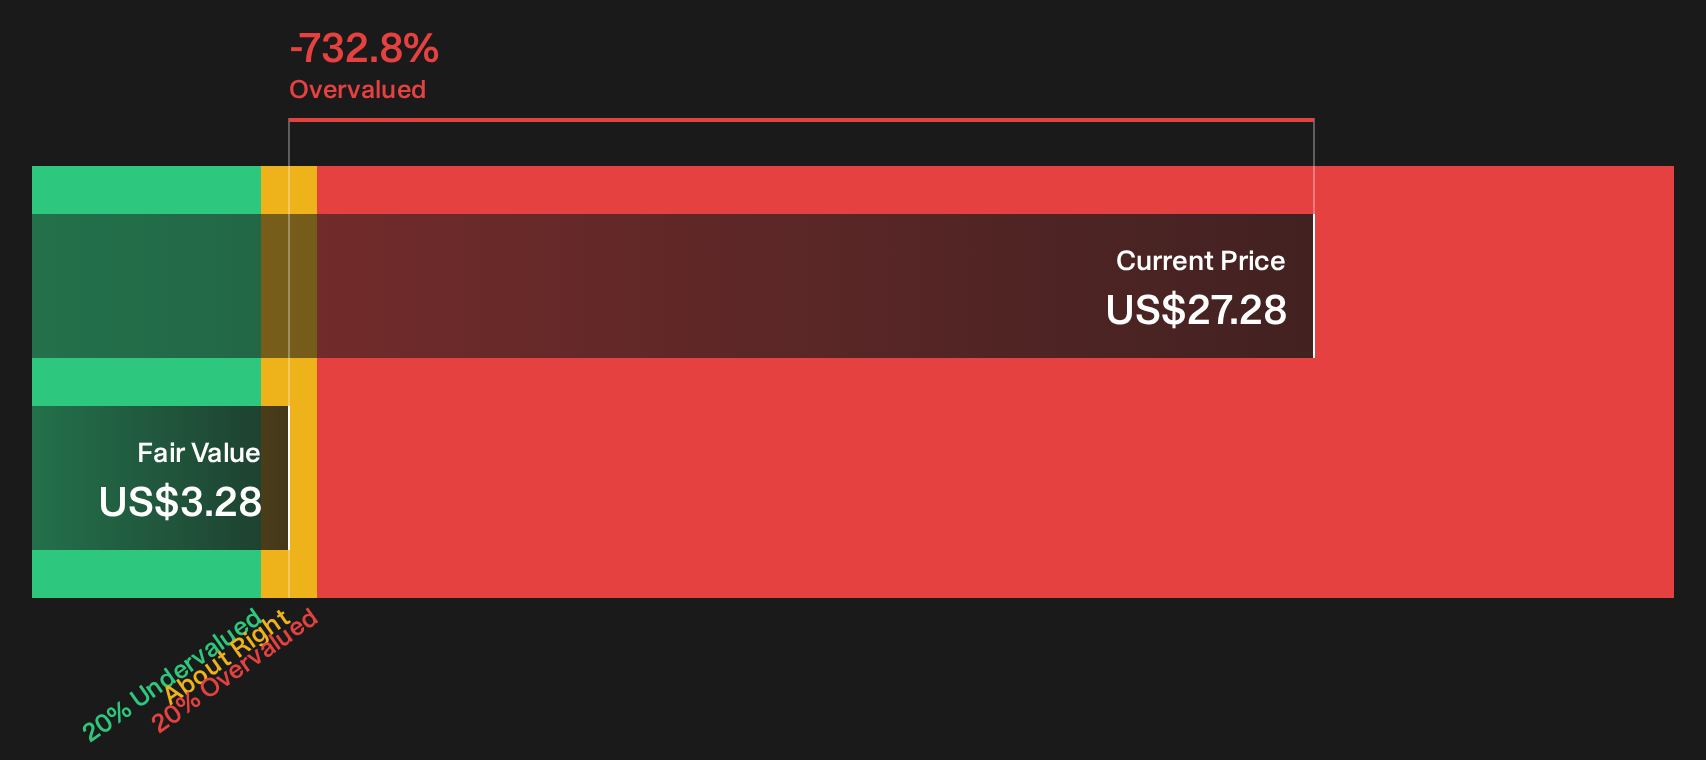
Simply Wall St performs a discounted cash flow (DCF) on every stock in the world every day (check out Viking Therapeutics for example). We show the entire calculation in full. You can track the result in your watchlist or portfolio and be alerted when this changes, or use our stock screener to discover 36 high quality undervalued stocks. If you save a screener we even alert you when new companies match - so you never miss a potential opportunity.
Next Steps
Worried that this read on Viking Therapeutics skews too bearish or too optimistic? Move quickly, review the underlying figures, and weigh the 3 important warning signs.
Looking for more Viking Therapeutics style investment ideas?
If Viking Therapeutics has sharpened your focus on risk and reward, use that same lens to scan other opportunities before the market moves past you.
- Chase potential mispricing by reviewing a curated 36 high quality undervalued stocks that filters for quality fundamentals at prices that may not fully reflect underlying strength.
- Strengthen your income stream by assessing a focused 5 dividend fortresses that highlights higher yield opportunities with an eye on durability.
- Protect your downside by scanning a targeted 29 resilient stocks with low risk scores that screens for resilience when conditions turn choppy.
Have feedback on this article? Concerned about the content? Get in touch with us directly. Alternatively, email editorial-team@simplywallst.com