
Tompkins Financial (TMP) Posted Strong Q3 Results And Raised Its Dividend, Is The Stock Still Cheap?
Why Tompkins Financial Stock Is Back on Investor Radar
Tompkins Financial (TMP) recently reported higher third quarter net income and net interest income, along with a dividend increase to $0.74 per share. This combination is drawing fresh attention to the stock.
Recent price action has cooled slightly, with the share price slipping 2.1% over the last day and 2.9% over the past week. Even so, Tompkins Financial still carries strong momentum, with a 37.3% year to date share price return and a 58.5% 1 year total shareholder return that points to investors reassessing both its earnings resilience and dividend profile.
Scan beyond Tompkins Financial and compare its recent earnings strength and dividend bump with a curated set of 36 high quality undervalued stocks that also pair cash generation with balance sheet support.
After a strong run in Tompkins Financial and a small pullback in recent days, investors face a clear tension: lock in exposure now, or wait for a cheaper entry as valuation work comes into focus next?
Preferred Multiple of 7.9x P/E: Is It Justified?
Valuation on Tompkins Financial today starts with its P/E ratio of 7.9x, which screens as low against both peers and the wider US Banks sector while the share price closed at $99.52.
The P/E multiple compares what investors pay for each dollar of earnings. For a regional bank like Tompkins Financial, it gives a quick read on how the market is weighing recent profit strength, future expectations, and perceived risk.
Management has delivered strong earnings growth in recent years, with profit expanding 17.8% per year over the past 5 years and 113.4% over the last year. That track record, paired with high quality earnings and higher current net profit margins of 40.2% versus 26.7% a year ago, sits next to forecasts that point to declining earnings and revenue over the next 3 years. The market could be using a lower P/E to balance those two opposing signals.
The gap to peers is clear. Tompkins Financial trades on a 7.9x P/E compared with a peer average of 15.2x and a US Banks industry average of 11.3x. The estimated fair P/E is also 7.9x, which implies the current multiple is already at the level the market could move towards if sentiment and fundamentals stay aligned.
Explore the SWS fair ratio for Tompkins Financial.
Result: Price-to-Earnings of 7.9x (UNDERVALUED)
Still, the story around Tompkins Financial can change quickly if annual revenue and net income declines persist, or if investor enthusiasm after a 58.5% 1 year return cools.
Find out about the key risks to this Tompkins Financial narrative.
Another View On Tompkins Financial’s Value
The earnings based P/E story is only one angle. Our DCF model points to a future cash flow value of $129.74 per share, compared with Tompkins Financial’s recent price of $99.52. That gap frames the stock as undervalued on cash flows, even as earnings are forecast to decline.
Look into how the SWS DCF model arrives at its fair value.
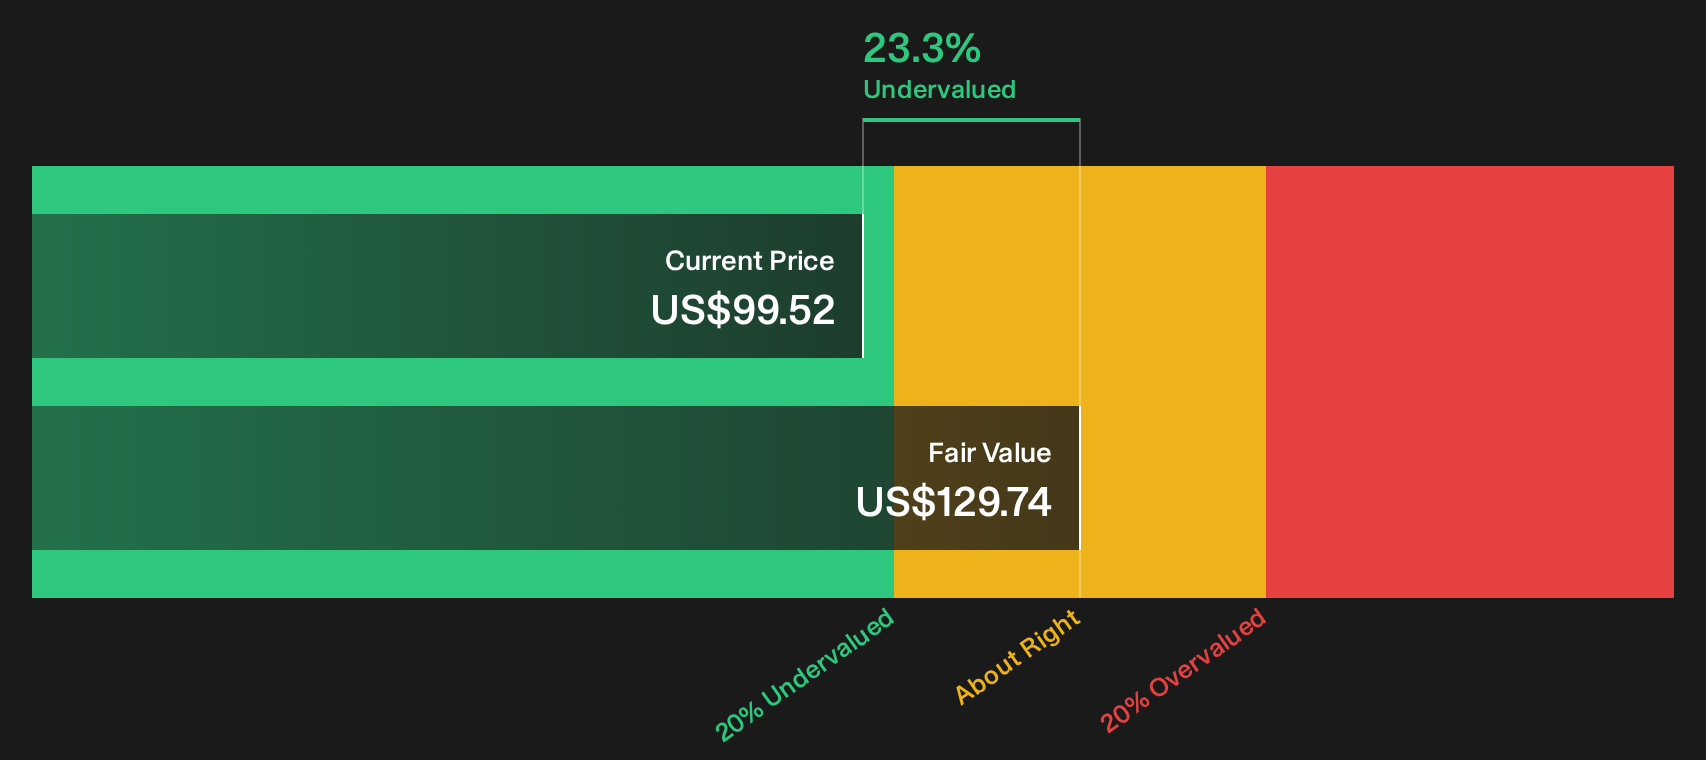
Simply Wall St performs a discounted cash flow (DCF) on every stock in the world every day (check out Tompkins Financial for example). We show the entire calculation in full. You can track the result in your watchlist or portfolio and be alerted when this changes, or use our stock screener to discover 36 high quality undervalued stocks. If you save a screener we even alert you when new companies match - so you never miss a potential opportunity.
Next Steps
Mixed about the tone of Tompkins Financial so far. Use the numbers as your guide and move quickly enough to form your own conviction with the 3 key rewards and 1 important warning sign.
Looking for more investment ideas beyond Tompkins Financial?
Do not stop with Tompkins Financial. Broaden your watchlist with other clear setups so you are not relying on a single story when the next move comes.
- Target stronger upside potential by scanning a curated pool of 36 high quality undervalued stocks that combine solid fundamentals with pricing that still looks compressed.
- Build a steadier income stream by focusing on a hand picked group of 5 dividend fortresses that aim to balance yield with business quality.
- Prioritise capital protection first by filtering for 29 resilient stocks with low risk scores that score well on financial strength and business stability.
Have feedback on this article? Concerned about the content? Get in touch with us directly. Alternatively, email editorial-team@simplywallst.com