
NSD (TSE:9759) Half Year Growth Brings Its Valuation Back Into Focus
NSD (TSE:9759) just released half year results to September 30, 2026, reporting sales of ¥62,330 million, net income of ¥5,778 million, and basic earnings per share of ¥76.4 from continuing operations.
The latest half-year results arrived in a market that has been warming up to NSD again. The share price is now ¥3,111, with a 90-day share price return of 11.03% and a 30-day gain of 4.38%, even though the move over the past week has cooled slightly. Over a longer stretch, total shareholder return is down 2.31% over the past year but still up 28.18% over three years and 61.62% over five years. This suggests momentum has eased recently after a solid multi-year run as investors reassess both growth prospects and risk after the earnings update.
Scan how NSD compares with other IT stocks riding earnings catalysts by reviewing our hand picked 71 high quality undiscovered gems in the software and services space.
NSD now trades below both its own estimated value and analyst targets after the earnings bounce. Is that a genuine discount, or is the market quietly flagging real risk?
Preferred P/E of 17.5x: Is it justified for NSD?
NSD changes hands at a P/E of 17.5x, which prices the stock below its own estimated fair P/E but above the broader Japan IT peer group.
The P/E ratio compares the share price to earnings per share and gives you a sense of how much investors are paying for each unit of profit. For an IT solutions provider like NSD, this matters because earnings quality, contract visibility, and the balance between services and software all feed into what investors are willing to pay.
NSD is described as good value compared with an estimated fair P/E of 19.2x. This implies the current 17.5x multiple sits at a discount to where the market could reasonably trade if sentiment aligned with that fair level. At the same time, the stock is labelled expensive relative to the Japan IT industry average of 16.1x, so the market is assigning a richer multiple than the sector while still leaving a gap to the fair ratio.
The peer comparison pushes this further. NSD is flagged as good value against a peer average P/E of 24.6x, which is a much higher bar. That combination, trading below a fair P/E estimate and well below the peer average but slightly above the industry average, indicates that investors are paying a premium for the business compared with the sector overall while keeping the valuation restrained versus closer peers that carry higher earnings multiples.
Explore the SWS fair ratio for NSD.
Result: Price-to-earnings of 17.5x (UNDERVALUED)
Still, NSD faces clear pressure if client IT spending softens or if peers with higher P/E ratios begin to reset pricing expectations across the sector.
Find out about the key risks to this NSD narrative.
Another View: NSD through a Cash Flow Lens
The earnings multiple paints NSD as modestly cheap. A second lens tells a similar story. Our DCF model points to a future cash flow value of ¥3,602.67 per share versus the current ¥3,111, which frames the stock as undervalued on cash flows as well. Is the market discount more about growth nerves than fundamentals?
Look into how the SWS DCF model arrives at its fair value.
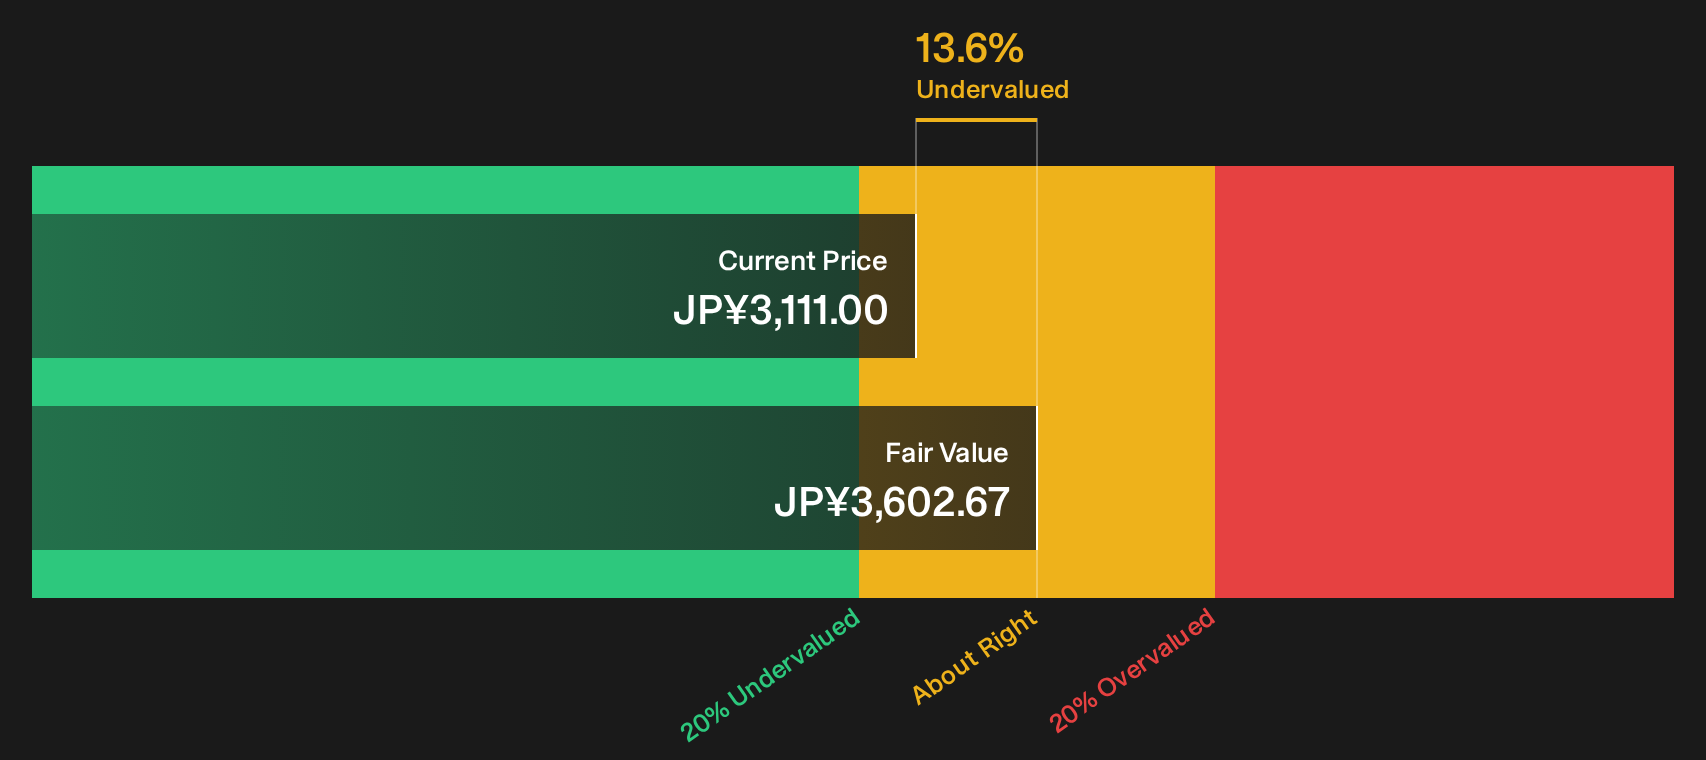
Simply Wall St performs a discounted cash flow (DCF) on every stock in the world every day (check out NSD for example). We show the entire calculation in full. You can track the result in your watchlist or portfolio and be alerted when this changes, or use our stock screener to discover 14 high quality undervalued stocks. If you save a screener we even alert you when new companies match - so you never miss a potential opportunity.
Next Steps
If the tone of this NSD update feels cautiously optimistic, treat it as a starting point rather than a verdict, and put the numbers in your own context. To see what the optimism is based on in more detail, review the 4 key rewards
Looking for more investment ideas beyond NSD?
If NSD is on your radar, do not stop here. Fresh ideas often come from scanning outside your comfort zone, where other opportunities quietly build.
- Target resilient balance sheets and steady fundamentals by reviewing our list of solid balance sheet and fundamentals (22 results) that filter for financially robust businesses.
- Hunt for quality at a reasonable price using the 14 high quality undervalued stocks that focus on companies trading below their estimated worth.
- Build a watchlist of lesser known opportunities by running through the 71 high quality undiscovered gems that surface quieter stories with strong underlying metrics.
Have feedback on this article? Concerned about the content? Get in touch with us directly. Alternatively, email editorial-team@simplywallst.com