
Aisin (TSE:7259) The Latest Update Raises A Bigger Question
Aisin stock reacts to fresh earnings, guidance and dividend news
Aisin (TSE:7259) has just combined fresh half year results with new Fiscal Year 2027 guidance and a higher interim dividend, giving investors updated numbers to assess both profitability and shareholder returns.
These announcements landed after a tough stretch for Aisin holders, with the share price down about 31% year to date and the 1 year total shareholder return declining 22%. However, the 5 year total shareholder return is still up roughly 82%.
Scan beyond Aisin by reviewing the hand picked 14 high quality undervalued stocks that combine earnings power with balance sheet strength.
So is the sharp year to date slide in Aisin, even as it posts higher half year sales and raises its dividend, really about business quality, or is it just sentiment resetting around the new guidance and earnings run rate?
Preferred P/E of 9.5x on Aisin: Is it justified?
Aisin currently trades on a P/E of 9.5x, and at a last close of ¥2,081 this valuation sits well below several reference points that suggest the market may be pricing its earnings cautiously relative to some fair value models and peer averages.
The P/E ratio compares the share price to earnings per share. For a manufacturer like Aisin, which reports revenue of ¥5.30b and net income of ¥151.55b, this gauge shows how much investors are paying for each unit of current profit, rather than for sales or assets that might be harder to interpret.
On Simply Wall St's checks, Aisin is described as good value at a P/E of 9.5x compared with the peer average of 19.1x. That gap is wide, and it suggests the market is assigning a lower earnings multiple than the peer group even though earnings are forecast to grow 8.46% per year and analysts are in tight agreement that the stock is trading below their target level. Against an estimated fair P/E of 12.9x, the current ratio is also presented as good value, which frames 12.9x as a level the market could gravitate toward if sentiment shifts.
Relative to the JP Auto Components industry, the same 9.5x P/E is described as expensive because it matches the sector average of 9.5x. That language implies little or no discount to the broader group even though other checks show Aisin at 61.2% below one fair value estimate and trading below a discounted cash flow value of ¥5,357.87 based on the SWS DCF model.
Explore the SWS fair ratio for Aisin.
Result: Price-to-earnings of 9.5x (UNDERVALUED).
Still, Aisin relies heavily on Japan and North America for revenue, and any reset in analyst expectations or pricing for auto components could pressure that P/E narrative.
Find out about the key risks to this Aisin narrative.
Another view on Aisin’s value: cash flows, not just earnings
The P/E story paints Aisin as inexpensive, yet the SWS DCF model points to something stronger. At a share price of ¥2,081 and an estimated future cash flow value of ¥5,357.87, the stock is framed as materially undervalued on projected cash generation. That gap raises a simple question for investors: Is the market discounting those future cash flows too heavily, or is the model being too generous about what Aisin can deliver?
Look into how the SWS DCF model arrives at its fair value.
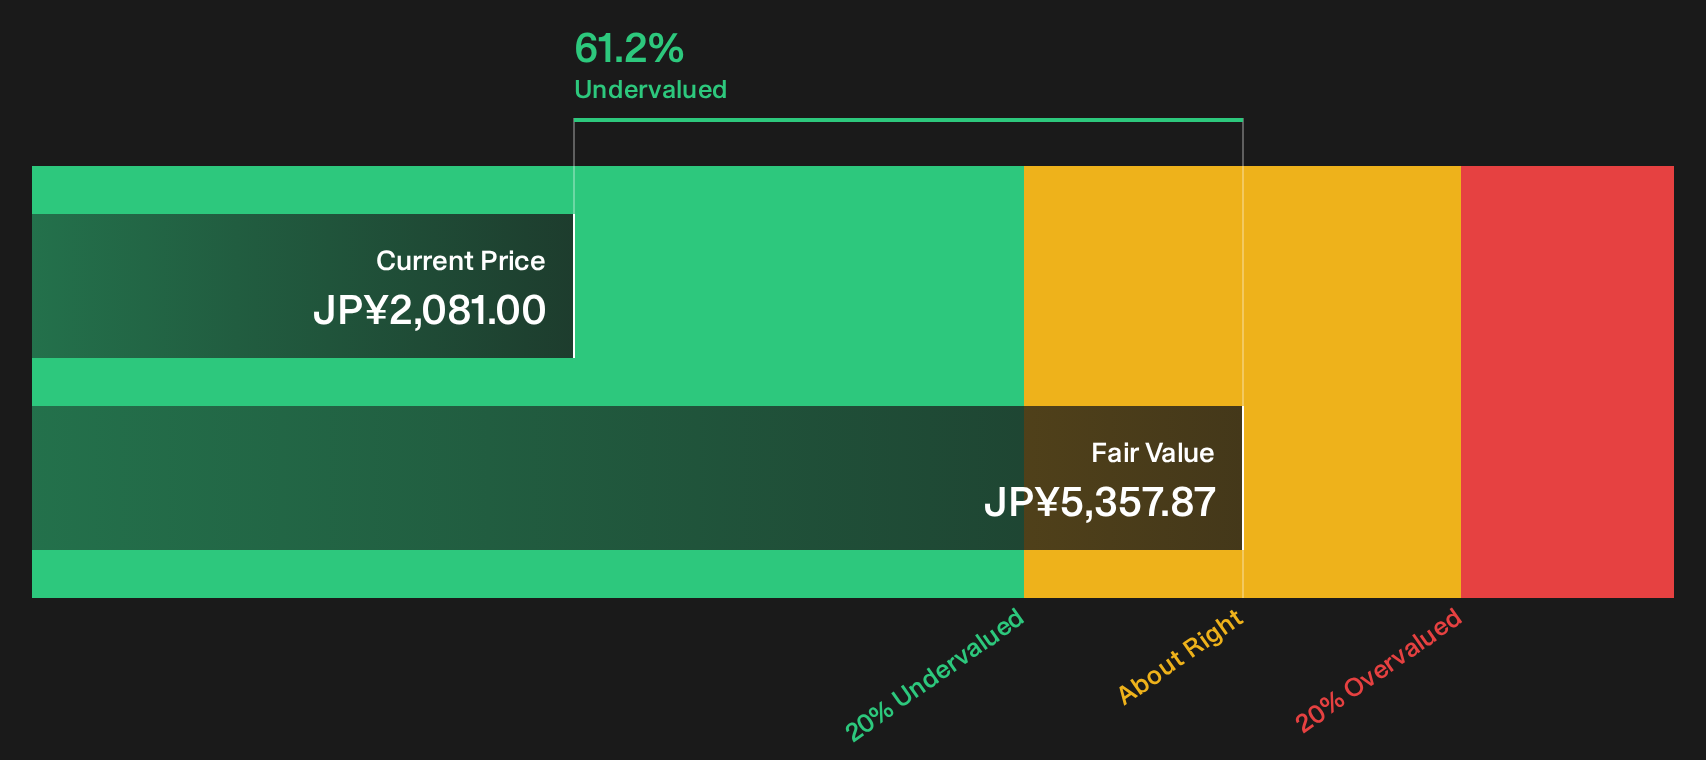
Simply Wall St performs a discounted cash flow (DCF) on every stock in the world every day (check out Aisin for example). We show the entire calculation in full. You can track the result in your watchlist or portfolio and be alerted when this changes, or use our stock screener to discover 14 high quality undervalued stocks. If you save a screener we even alert you when new companies match - so you never miss a potential opportunity.
Next Steps
Mixed signals on Aisin so far, with a cheap-looking valuation on one side and fresh guidance and dividend signals on the other, mean the next move is yours. Before reacting, check the 3 key rewards and 1 important warning sign
Looking for more Aisin-like investment ideas?
If Aisin has sharpened your focus on valuation and quality, do not stop here. The screener uncovers ideas that might suit your risk level and income goals.
- Hunt for potential mispricings by reviewing the 14 high quality undervalued stocks that pair solid fundamentals with more modest market expectations.
- Build a sturdier core for your portfolio by using the list of solid balance sheet and fundamentals (22 results) that highlight companies with stronger financial footing.
- Spot potential future leaders early by scanning the 71 high quality undiscovered gems that combine quality metrics with lower market attention.
Have feedback on this article? Concerned about the content? Get in touch with us directly. Alternatively, email editorial-team@simplywallst.com