
Should Return To Profit Require Action From Horizon Bancorp Stock Investors?
- Horizon Bancorp reported third quarter 2026 results with net interest income of US$65.16 million and net income of US$28.67 million, compared with a net loss in the same period last year and basic earnings per share from continuing operations of US$0.56.
- The bank recorded total net charge offs of US$1.19 million in the quarter compared with US$0.83 million a year earlier, giving investors fresh data on how credit costs are tracking alongside the earnings recovery.
- We will now look at how Horizon Bancorp’s sharp swing back to positive earnings may influence the broader investment narrative around the bank.
Compare Horizon Bancorp’s return to profit with that of other regional banks by reviewing our hand picked list of list of solid balance sheet and fundamentals (24 results)
Horizon Bancorp Investment Narrative Recap
For a shareholder to stay comfortable with Horizon Bancorp, the core belief is that its Midwestern community banking model can keep generating steady earnings from loans, deposits, and fee businesses. The sharp return to profit in the third quarter supports that view, yet only if the improvement proves repeatable across future reporting periods.
The near term swing factor is how well Horizon Bancorp manages credit quality and funding costs while growing commercial and equipment finance lending. The higher net interest income is helpful, but the rise in net charge offs underlines that credit costs remain a live risk, especially if competition for both loans and deposits stays intense.
The key announcement here is the third quarter 2026 earnings release, which showed net interest income of US$65.16 million and net income of US$28.67 million after a loss a year earlier. That level of profit recovery gives Horizon Bancorp more flexibility to keep investing in fee based lines such as fiduciary activities, mortgage, and interchange income.
Net charge offs of US$1.19 million for the quarter, compared with US$0.83 million a year earlier, matter for the thesis as the bank leans further into higher yielding commercial and equipment finance loans. For readers, the question is whether current credit trends stay compatible with the goal of maintaining healthy net interest margins while avoiding fresh legal or compliance hits.
Horizon Bancorp Long Term Assumptions
Analysts have set out a fairly specific roadmap for Horizon Bancorp, tying its current share price to where revenue and earnings might land a few years from now. The projections frame a future where the income statement looks very different from today and give you some concrete numbers to stress test against your own view of the bank.
In the stock analysis report, the core building block is top line performance. Forecast revenue is US$529.7 million by 2029, up from what the report describes as essentially no revenue today. Put simply, the analyst model assumes Horizon Bancorp fills in that revenue line over the next few years, rather than treating the recent pre revenue status in the assumptions section as a steady state.
Earnings expectations are even more of a swing. Profit is forecast to reach US$232.9 million by 2029, compared with an earnings loss of US$144.0 million today. That is a US$376.9 million change in the income line from loss making to solidly in the black, alongside an earnings per share target of US$2.35 that underpins the rest of the thesis.
To bridge that gap, the consensus framework assumes Horizon Bancorp eventually runs at a 44.0% profit margin in around three years time. That margin assumption effectively compresses a lot of moving parts into one figure, from credit costs and fee income to funding expenses and overheads. For you, the question is whether a banking business with this footprint can realistically support that level of profitability once credit cycles, technology spend, and regulatory costs are factored in.
The P/E multiple assumptions add another layer. The analysis works off a future P/E of 6.3x on those 2029 earnings, compared with a current implied multiple of 6.9x on today’s loss making base. The future valuation multiple in the model sits below the 11.5x figure quoted for the wider US banks industry, so the story is not about a premium rating. It is about whether the earnings line can actually reach the level that would make that 6.3x feel reasonable.
Horizon Bancorp's narrative projects US$529.7 million revenue and US$232.9 million earnings by 2029. This requires an earnings increase of US$376.9 million from an earnings loss of US$144.0 million today.
The share count assumptions are relatively modest compared with the earnings swing. Analysts bake in 0.25% share growth per year over the next three years. That kind of dilution would usually be manageable for most investors if the earnings curve tracks anything like the forecast, since the implied profit uplift more than offsets the extra shares in the model.
Horizon Bancorp Valuation Anchors
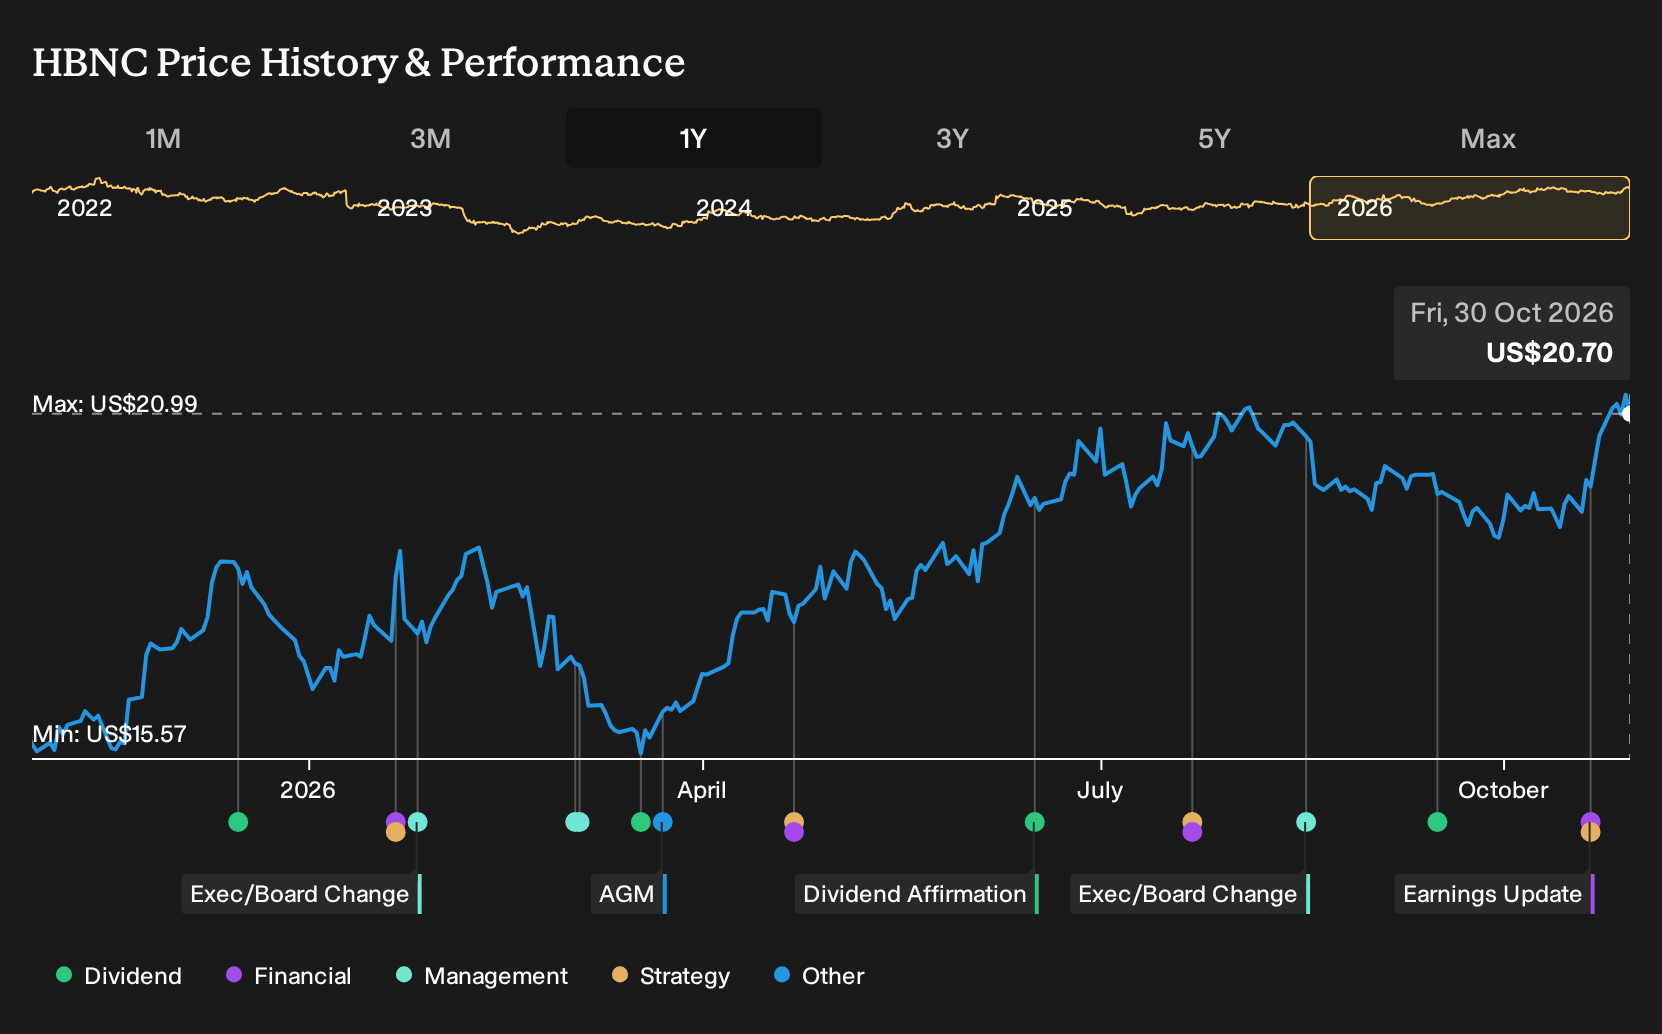
All of these assumptions roll into a simple headline figure that gets most of the attention. The analyst group consensus price target for Horizon Bancorp sits at US$23.10 per share, compared with a current share price of US$19.31 as of the latest report. That gap is framed as a 16.4% difference between where the stock trades today and where the group of covering analysts think it is worth based on their scenario.
Behind that single target sit the same income statement markers. The valuation work assumes Horizon Bancorp can reach US$529.7 million of revenue and US$232.9 million of earnings by 2029 while trading on that 6.3x P/E multiple, using a discount rate of roughly 7.2% to translate those future cash flows into a present value. The discount rate choice matters because even small changes affect how much weight is placed on that forecast 2029 profit number in today’s valuation.
For readers, the practical use of these figures is not as a verdict on what the share price should be. The real value lies in treating the revenue, earnings, margin and P/E inputs as dials to turn. If your own view on Horizon Bancorp’s credit costs, growth in fee based income, or competitive pressures is more conservative than the consensus, your personal fair value will likely sit below the current analyst target. If you are more optimistic on those same drivers, your estimate could land higher even if you use a similar discount rate.
The analysis encourages that kind of cross check. Rather than taking the US$23.10 number at face value, compare it with your own expectations about what Horizon Bancorp can realistically earn by 2029 and what multiple a Midwestern community focused bank might command given its risk profile and business mix at that point.
Discover how Horizon Bancorp's fair value indicates a potential 12% upside to its current price that may not last much longer.
Exploring Other Perspectives
Two fair value estimates from the Simply Wall St Community span from US$23.10 to about US$49.77, so some retail investors see Horizon Bancorp as close to fairly priced while others expect a far higher payoff. In contrast, there is rising competition, higher net charge offs, and ongoing digital investment needs. Explore the full range of community views yourself.
Explore another Horizon Bancorp fair value estimate, including one that suggests it could be worth just $23.10.
The Verdict Is Yours
Don't just follow the ticker. Dig into the data and build a conviction that's truly your own.
- A great starting point for your Horizon Bancorp research is our analysis highlighting 5 key rewards that could impact your investment decision.
- See our latest analysis for Horizon Bancorp. The report includes a comprehensive fundamental analysis summarized in a single visual, the Snowflake, making it easy to evaluate Horizon Bancorp's overall financial health at a glance.
Looking for more Horizon Bancorp sized ideas?
If Horizon Bancorp is only one piece of your watchlist, it can help to scan a wider field of opportunities that share similar financial strengths or different return profiles. The Simply Wall St Screener lets you filter for balance sheet quality, income potential, and risk levels so you can line up a shortlist that truly fits your own plan.
- If capital protection is high on your list, start with companies that score well on resilience and financial stability through our 29 resilient stocks with low risk scores.
- For readers focused on long term total return potential, sort for stocks that pair strong fundamentals with valuations that look appealing using the 33 high quality undervalued stocks.
- Income focused investors can narrow the field to payouts above 5% and put steady cash flows at the center of their research with a curated set of 5 dividend fortresses.
Have feedback on this article? Concerned about the content? Get in touch with us directly. Alternatively, email editorial-team@simplywallst.com