
Why Did St. Joe (JOE) Move Today?
St. Joe (JOE) just packed three updates into a single week, combining third quarter earnings, a higher cash dividend, and a key residential leadership hire that gives investors fresh numbers and context to work with.
At a share price of $70.02, St. Joe has given investors a 30 day share price return of 7.10% and a year to date share price gain of 17.07%. The 1 year total shareholder return of 24.53% and 5 year total shareholder return of 48.03% suggest momentum has been building rather than fading around these earnings, dividend and leadership updates.
Scan beyond St. Joe and line up other real estate and income-focused opportunities using our curated list of 5 dividend fortresses
St. Joe now couples a higher dividend with solid recent earnings, and the share price has already moved. The business looks sturdy on paper. The real tension sits in what investors are paying for it today.
Price-to-Earnings of 32.6x: Is it justified?
St. Joe trades on a P/E of 32.6x, which means investors are paying a premium on the recent $70.02 share price compared with peers.
The P/E ratio compares the current share price to the last year of earnings per share and is a common yardstick for real estate and other income-focused businesses. A higher P/E usually reflects investors accepting a richer price for each dollar of profit.
For St. Joe, that premium sits against a backdrop of high quality earnings, 10.3% annual earnings growth over the past 5 years, and net profit margins of 22.3% compared with 21.4% a year earlier. Earnings growth over the past year of 15.9% also runs ahead of that 5 year average, which can help explain why investors might tolerate a higher multiple, even if growth has not exceeded the wider Real Estate industry.
The valuation gap is still stark. Management's stock trades on a 32.6x P/E against a US Real Estate industry average of 14.7x and a peer group at 26.5x. The market is therefore assigning a much richer tag to St. Joe than to sector alternatives.
See what the numbers say about this price — find out in our valuation breakdown.
Result: Price-to-Earnings of 32.6x (OVERVALUED)
Still, the St. Joe story depends heavily on continued real estate demand in its markets and on investors remaining willing to pay a rich earnings multiple.
Find out about the key risks to this St. Joe narrative.
Another view on St. Joe's value
The earnings multiple says St. Joe looks expensive, yet the SWS DCF model points the other way. On that cash flow view, the share price of $70.02 sits about 2.2% below an estimated value of $71.58, which labels the stock as slightly undervalued instead of stretched.
Two tools, two stories. One flags valuation risk if sentiment cools, and the other suggests limited upside if cash flows track expectations. Which lens do you trust more when both are only a whisker away from fair value and your margin for error is thin?
Look into how the SWS DCF model arrives at its fair value.
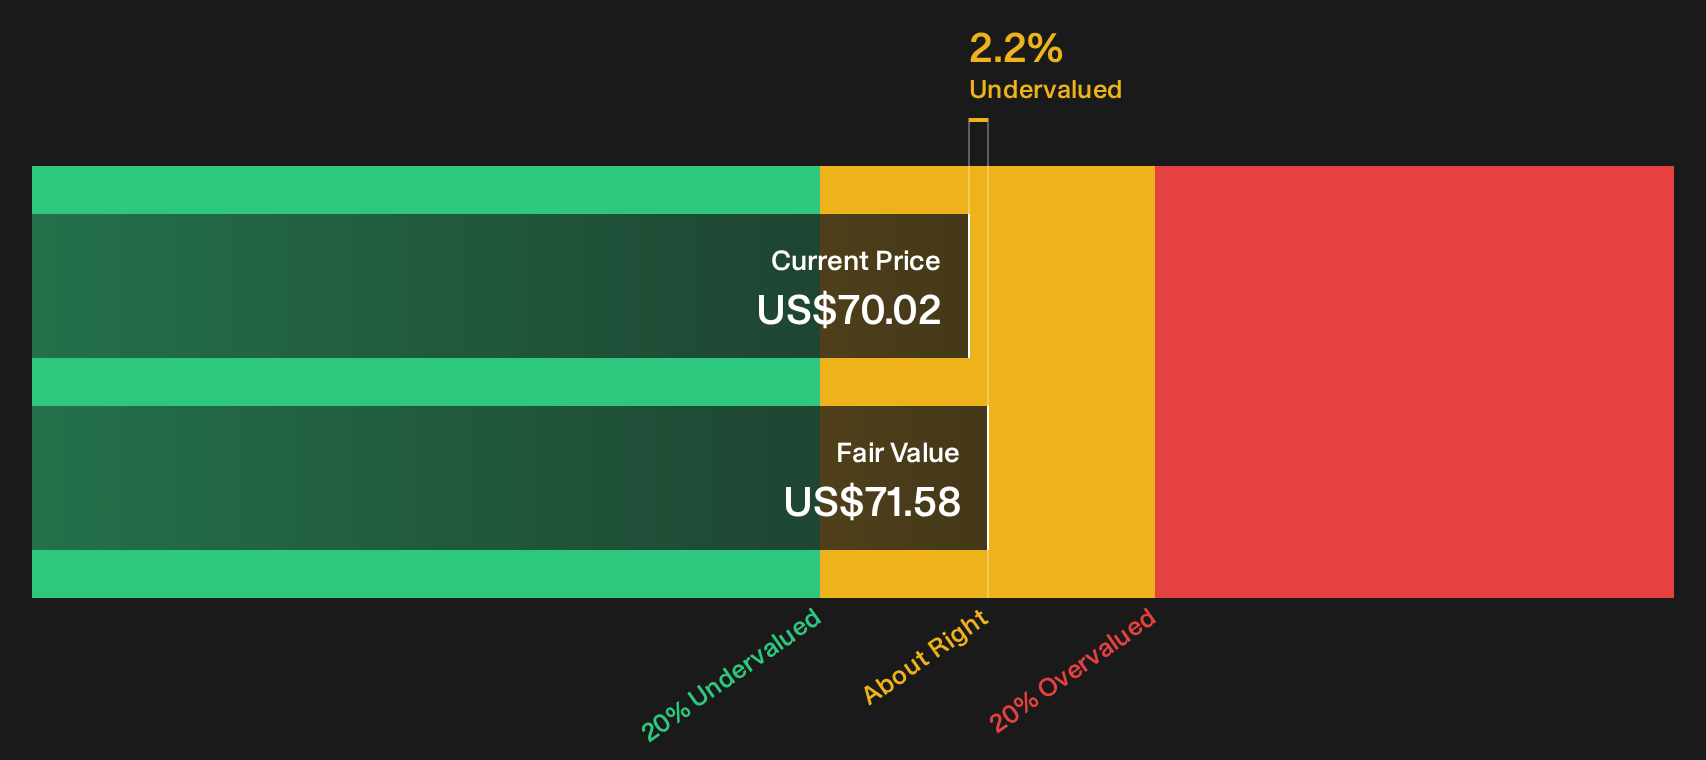
Simply Wall St performs a discounted cash flow (DCF) on every stock in the world every day (check out St. Joe for example). We show the entire calculation in full. You can track the result in your watchlist or portfolio and be alerted when this changes, or use our stock screener to discover 33 high quality undervalued stocks. If you save a screener we even alert you when new companies match - so you never miss a potential opportunity.
Next Steps
Curious whether the mixed signals around St. Joe add up to a buyable story or a stretched one? Act quickly, review the earnings, valuation and risk data for yourself, then round out your view with our breakdown of 2 key rewards and 1 important warning sign.
Looking for more St. Joe investment ideas?
Do not stop at St. Joe. If you want a fuller opportunity set, apply the same disciplined lens to other stocks using focused screeners that highlight clear traits.
- Target reliability with companies that pair stronger balance sheets and fundamentals by scanning our list of solid balance sheet and fundamentals (24 results).
- Hunt for pricing gaps where quality and valuation look better aligned by checking the 33 high quality undervalued stocks.
- Compare potential income ideas with St. Joe by reviewing our curated 5 dividend fortresses.
Have feedback on this article? Concerned about the content? Get in touch with us directly. Alternatively, email editorial-team@simplywallst.com