
Is TXNM Energy (TXNM) Fully Valued Following Its Strong Third Quarter Results?
TXNM Energy (TXNM) just put fresh numbers on the board, reporting third quarter 2026 results and an update for the first nine months that give investors new data to work with.
The 1 year total shareholder return of 5.79% and 3 year total shareholder return of 52.02% show TXNM Energy has rewarded patient holders, even as the year to date share price return has slipped 1.13% and short term moves around the current US$58.38 level reflect shifting views on earnings strength and deal risk around the Blackstone Infrastructure acquisition process.
Scan beyond TXNM Energy to see how other regulated utilities are priced for potential deal outcomes and earnings shocks with our hand-picked 30 resilient stocks with low risk scores.
TXNM Energy just delivered stronger third quarter earnings, yet the share price only edges below the analyst target. Is most of the gain already captured, or does the current valuation still leave meaningful upside on the table?
Price-to-Earnings of 32.8x: Is It Justified for TXNM Energy?
TXNM Energy now trades on a P/E of 32.8x, with the last close at $58.38 and our DCF model indicating a future cash flow value of $28.63. This frames the current level as rich compared with both intrinsic value estimates and peers.
The P/E ratio compares what investors pay for each dollar of earnings. For a regulated utility like TXNM Energy, it often reflects expectations around stable profits, allowed returns in its jurisdictions, and the risk profile of its capital structure. With high quality earnings reported and a recent 10.4% earnings growth rate over the past year, the market appears willing to pay a steeper multiple for this profile even though earnings have declined by 2.5% per year over the past 5 years.
That premium shows up clearly when set against the Electric Utilities industry. TXNM Energy trades on 32.8x earnings, while the US Electric Utilities group is closer to 20.2x and a peer set is around 20.1x. This is a strong gap that suggests investors are assuming a more generous outlook than both sector averages and the SWS DCF model, which values the stock at $28.63 based on projected future cash flows discounted back at an appropriate rate for utility risk.
See what the numbers say about this price — find out in our valuation breakdown.
Result: Price-to-Earnings of 32.8x (OVERVALUED)
Still, the Blackstone Infrastructure deal risk and the wide gap between TXNM Energy’s share price and DCF estimate could quickly flip sentiment if expectations reset.
Find out about the key risks to this TXNM Energy narrative.
Another View on TXNM Energy’s Valuation
The P/E makes TXNM Energy look expensive, yet the SWS DCF model presents a different view. With an estimated future cash flow value of $28.63 compared with a $58.38 share price, this second lens also identifies TXNM as overvalued. The key question is what might close that gap: the share price or market expectations.
Look into how the SWS DCF model arrives at its fair value.
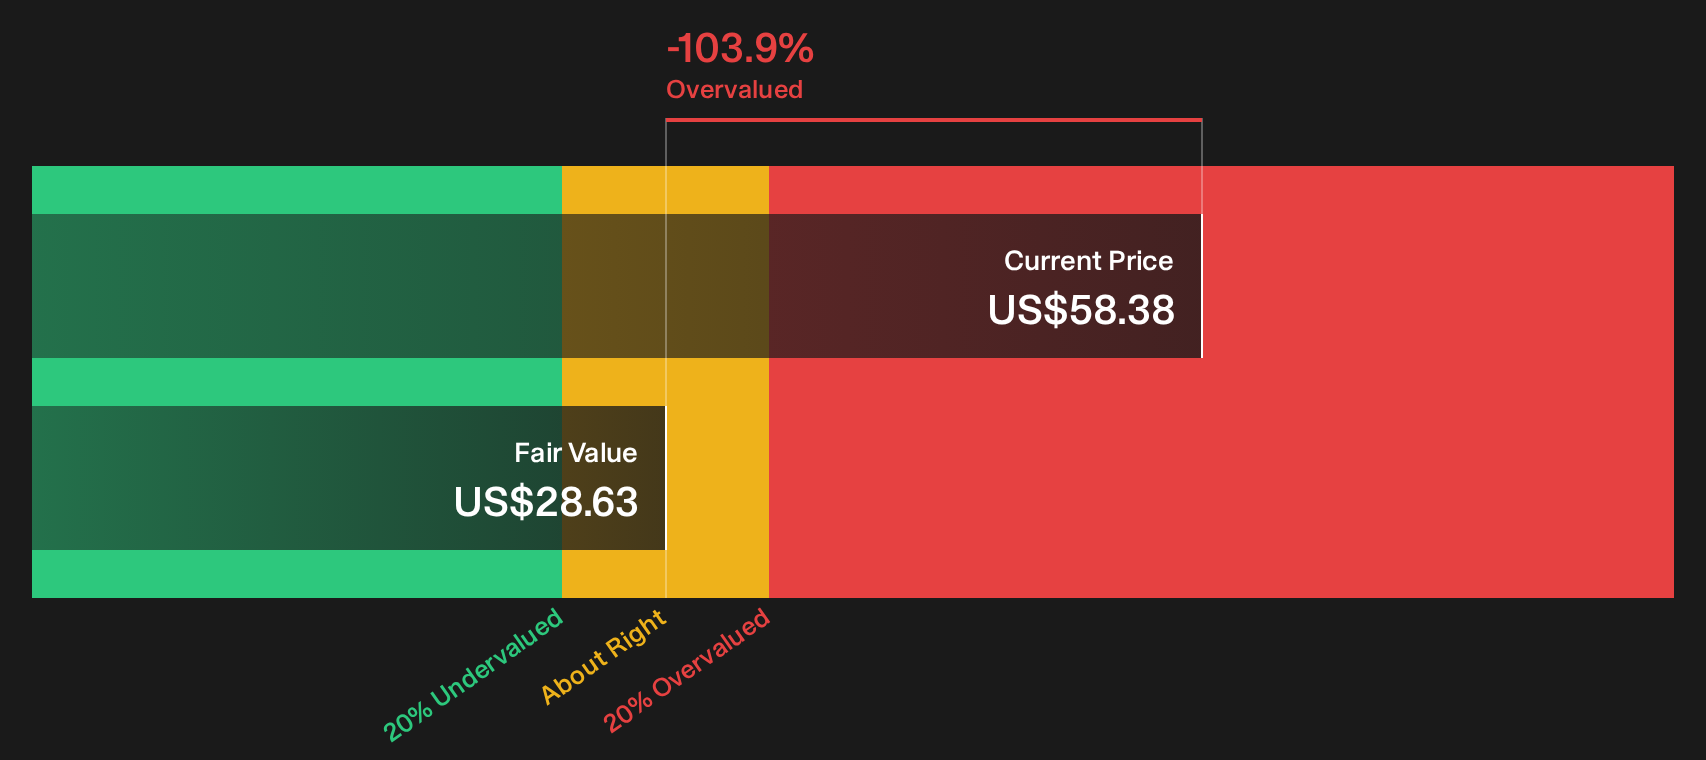
Simply Wall St performs a discounted cash flow (DCF) on every stock in the world every day (check out TXNM Energy for example). We show the entire calculation in full. You can track the result in your watchlist or portfolio and be alerted when this changes, or use our stock screener to discover 29 high quality undervalued stocks. If you save a screener we even alert you when new companies match - so you never miss a potential opportunity.
Next Steps
If TXNM Energy’s set up feels finely balanced between rich valuation and deal risk, use that tension as a prompt to review the full picture quickly and form your own stance based on the underlying data and expectations captured in our 1 key reward and 3 important warning signs.
Looking for more TXNM Energy style investment ideas?
If TXNM Energy leaves you questioning what else the market might be mispricing, do not stop here. Scan a wider field of opportunities and pressure test your next move using focused stock lists that surface distinct financial strengths and potential return profiles.
- Target resilient businesses that pair earnings power with calm balance sheets through a curated list of solid balance sheet and fundamentals (25 results).
- Hunt for companies where price and fundamentals look out of sync by checking a focused 29 high quality undervalued stocks.
- Spot earlier stage opportunities with room to mature by reviewing a hand picked 9 elite penny stocks with strong financials.
Have feedback on this article? Concerned about the content? Get in touch with us directly. Alternatively, email editorial-team@simplywallst.com