
CECO Environmental (CECO) On Index Removal And Whether Its Valuation Still Has Room
CECO Environmental (TXSE:CECO) has been removed from the NASDAQ Composite Index, a technical shake up that can prompt forced trading as index tracking funds and quant models rebalance exposure.
At a share price of US$54.70, CECO Environmental has seen short term momentum fade, with the 30 day share price return down 21.45% and the 90 day share price return down 16.98%, even as the 1 year total shareholder return is 11.88% and the 5 year total shareholder return is very large at more than 6x. The recent index removal and the upcoming Q3 2026 earnings date are giving traders fresh reasons to reassess both growth potential and risk.
Scan how CECO Environmental compares with other industrial players under pressure from index reshuffles and earnings catalysts by reviewing our curated list of list of solid balance sheet and fundamentals (23 results)
Strong multi year returns, rapid reported revenue and income growth, index related selling pressure, and an earnings loss all pull in different directions here. Which case does CECO Environmental’s current valuation actually support next?
Most Popular Narrative: 51% Undervalued
Against a last close of $54.70, the most followed narrative for CECO Environmental pegs fair value near $111.86. This frames the current pullback as a valuation gap rather than just a sentiment swing.
Backlog that has grown for 12 consecutive quarters to more than $1.8 billion and a sales pipeline that has expanded from about $1.5 billion in 2021 to over $8.5 billion by Q2 2026 give CECO Environmental a wide set of identified opportunities that can feed future revenue and provide potential operating leverage.
See why 12 investors see CECO Environmental as 51% undervalued.
Result: Fair Value of $111.86 (UNDERVALUED)
Still, concentrated exposure to large power and natural gas projects, along with uncertainty around leverage and interest costs, could quickly weaken the CECO Environmental narrative.
Find out about the key risks to this CECO Environmental narrative.
Another View: CECO Environmental On Sales-Based Valuation
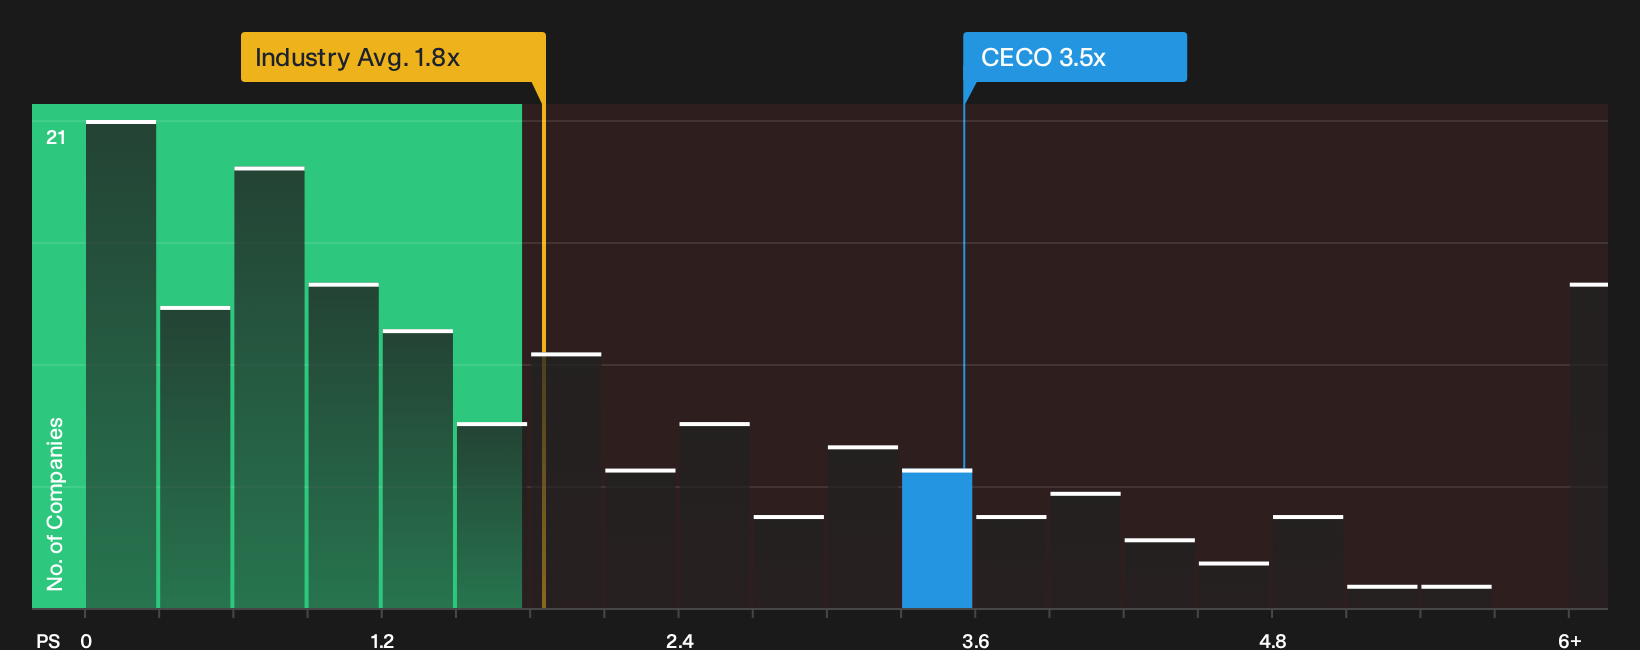
The SWS fair value and analyst narrative lean on discounted future cash flows. A simple sales multiple paints a different picture. CECO Environmental trades on a P/S of 3.5x, which is higher than the US Machinery industry at 1.7x and above peers at 2.7x, yet below an estimated fair ratio of 5.3x. That mix of rich relative pricing and cheaper fair ratio leaves you weighing whether this reflects early enthusiasm or a margin of safety that may narrow over time.
If you want to see how these sales based signals stack up against detailed earnings and balance sheet work, See what the numbers say about this price — find out in our valuation breakdown.
For a quick visual sense of how CECO Environmental’s current P/S compares with the sector, refer to
Next Steps
Mixed signals around CECO Environmental can feel messy, so consider this your prompt to move quickly, review the evidence yourself, and weigh both the concern and the opportunity captured in the 2 key rewards and 1 important warning sign.
Looking for more investment ideas beyond CECO Environmental?
If CECO Environmental has your attention, do not stop there. Use the Simply Wall St screener to quickly surface fresh ideas that match your approach.
- Target resilient balance sheets and steady fundamentals by scanning our focused list of solid balance sheet and fundamentals (23 results) screener, which filters for financial strength first.
- Hunt for potential mispriced opportunities by reviewing the 30 high quality undervalued stocks screener, which zeroes in on quality businesses trading below their assessed worth.
- Build a cash flow focused watchlist by checking out the 7 dividend fortresses screener, which highlights higher yielding companies with an income tilt.
Have feedback on this article? Concerned about the content? Get in touch with us directly. Alternatively, email editorial-team@simplywallst.com