
3 Asian Penny Stocks With Market Caps Over US$100M To Consider
Amidst the global market volatility driven by AI investment concerns and rising oil prices, Asian markets have been navigating a complex economic landscape. In such times, investors often look toward penny stocks as potential opportunities for growth. Although the term 'penny stock' might seem outdated, these smaller or newer companies can offer significant value when backed by strong financials.
Here we highlight a subset of our preferred stocks from the screener.
160 Health International (SEHK:2656)
Simply Wall St Financial Health Rating: ★★★★★☆
Overview: 160 Health International Limited engages in the wholesale and retail of pharmaceutical and healthcare products in China, with a market capitalization of approximately HK$1.16 billion.
Operations: The company's revenue primarily comes from the sale of pharmaceutical and healthcare products, totaling CN¥679.95 million.
Market Cap: HK$1.16B
160 Health International Limited, with a market cap of HK$1.16 billion, has recently shown signs of financial improvement by reporting a net income of CN¥2.14 million for the first half of 2026, compared to a loss in the previous year. Despite its unprofitability and high share price volatility, the company benefits from strong short-term asset coverage over liabilities and more cash than total debt. Recent strategic partnerships in AI computing power infrastructure highlight potential growth avenues but remain early-stage without assured revenue sustainability. The management team is experienced; however, insider selling raises concerns about internal confidence.
- Unlock comprehensive insights into our analysis of 160 Health International stock in this financial health report.
- Understand 160 Health International's track record by examining our performance history report.
China Shanshui Cement Group (SEHK:691)
Simply Wall St Financial Health Rating: ★★★★★☆
Overview: China Shanshui Cement Group Limited is an investment holding company involved in the manufacture and sale of cement, clinker, concrete, and related products and services in China with a market cap of HK$1.09 billion.
Operations: The company's revenue primarily comes from the manufacturing and trading of cement, clinker, and concrete, amounting to CN¥9.53 billion.
Market Cap: HK$1.09B
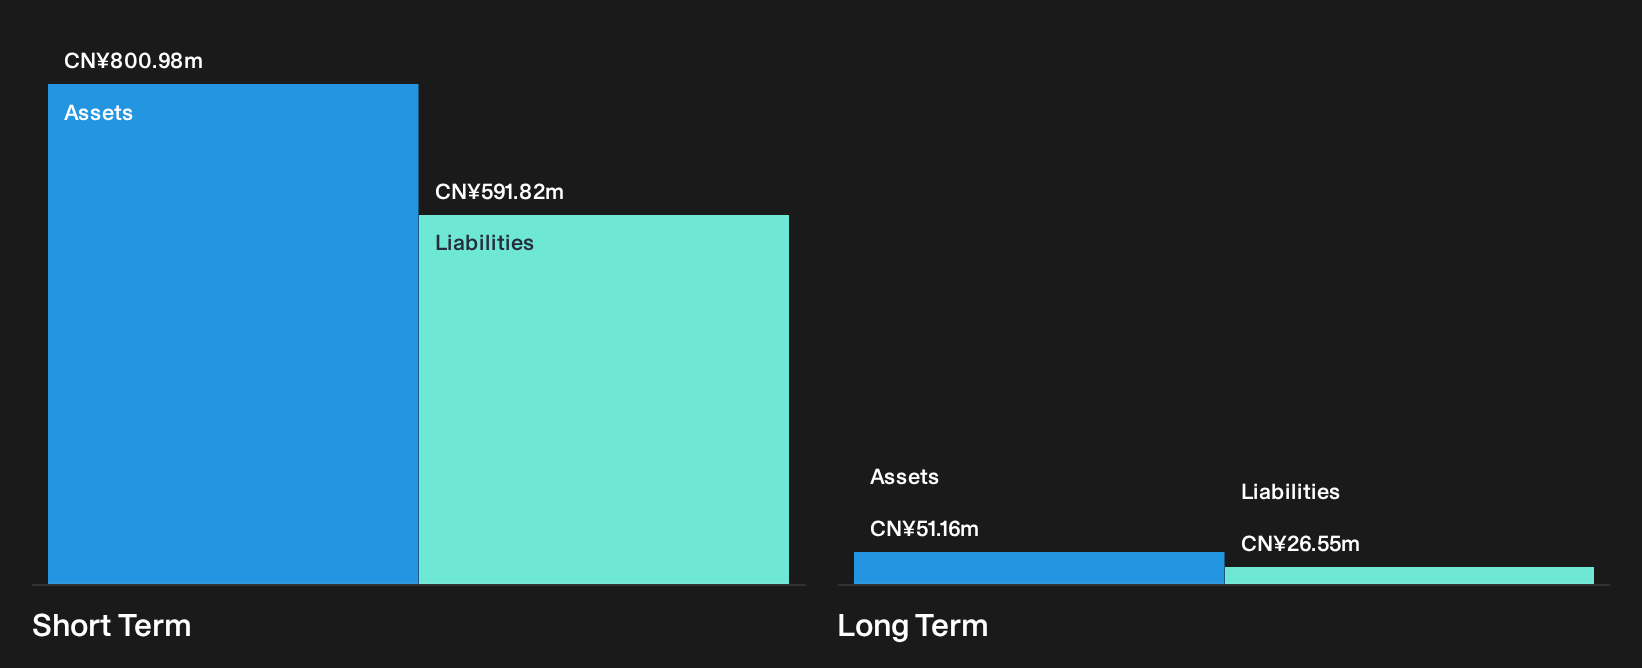
China Shanshui Cement Group's recent financial results highlight challenges, with sales declining to CN¥6.92 billion for the nine months ending September 2026, down from CN¥8.95 billion a year earlier, and a widening net loss of CN¥829.75 million. The company remains debt-free but faces significant short-term liabilities exceeding its assets by CN¥2.2 billion, while long-term liabilities are well-covered by assets. Despite an experienced management team and board, the company's negative return on equity and increased share price volatility underscore ongoing instability in its financial health and market perception.
- Dive into the specifics of China Shanshui Cement Group here with our thorough balance sheet health report.
- Examine China Shanshui Cement Group's past performance report to understand how it has performed in prior years.
Guizhou Xinbang Pharmaceutical (SZSE:002390)
Simply Wall St Financial Health Rating: ★★★★★★
Overview: Guizhou Xinbang Pharmaceutical Co., Ltd. manufactures and sells traditional Chinese medicine and other pharmaceutical products in China and internationally, with a market cap of CN¥5.52 billion.
Operations: Guizhou Xinbang Pharmaceutical Co., Ltd. has not disclosed specific revenue segments.
Market Cap: CN¥5.52B
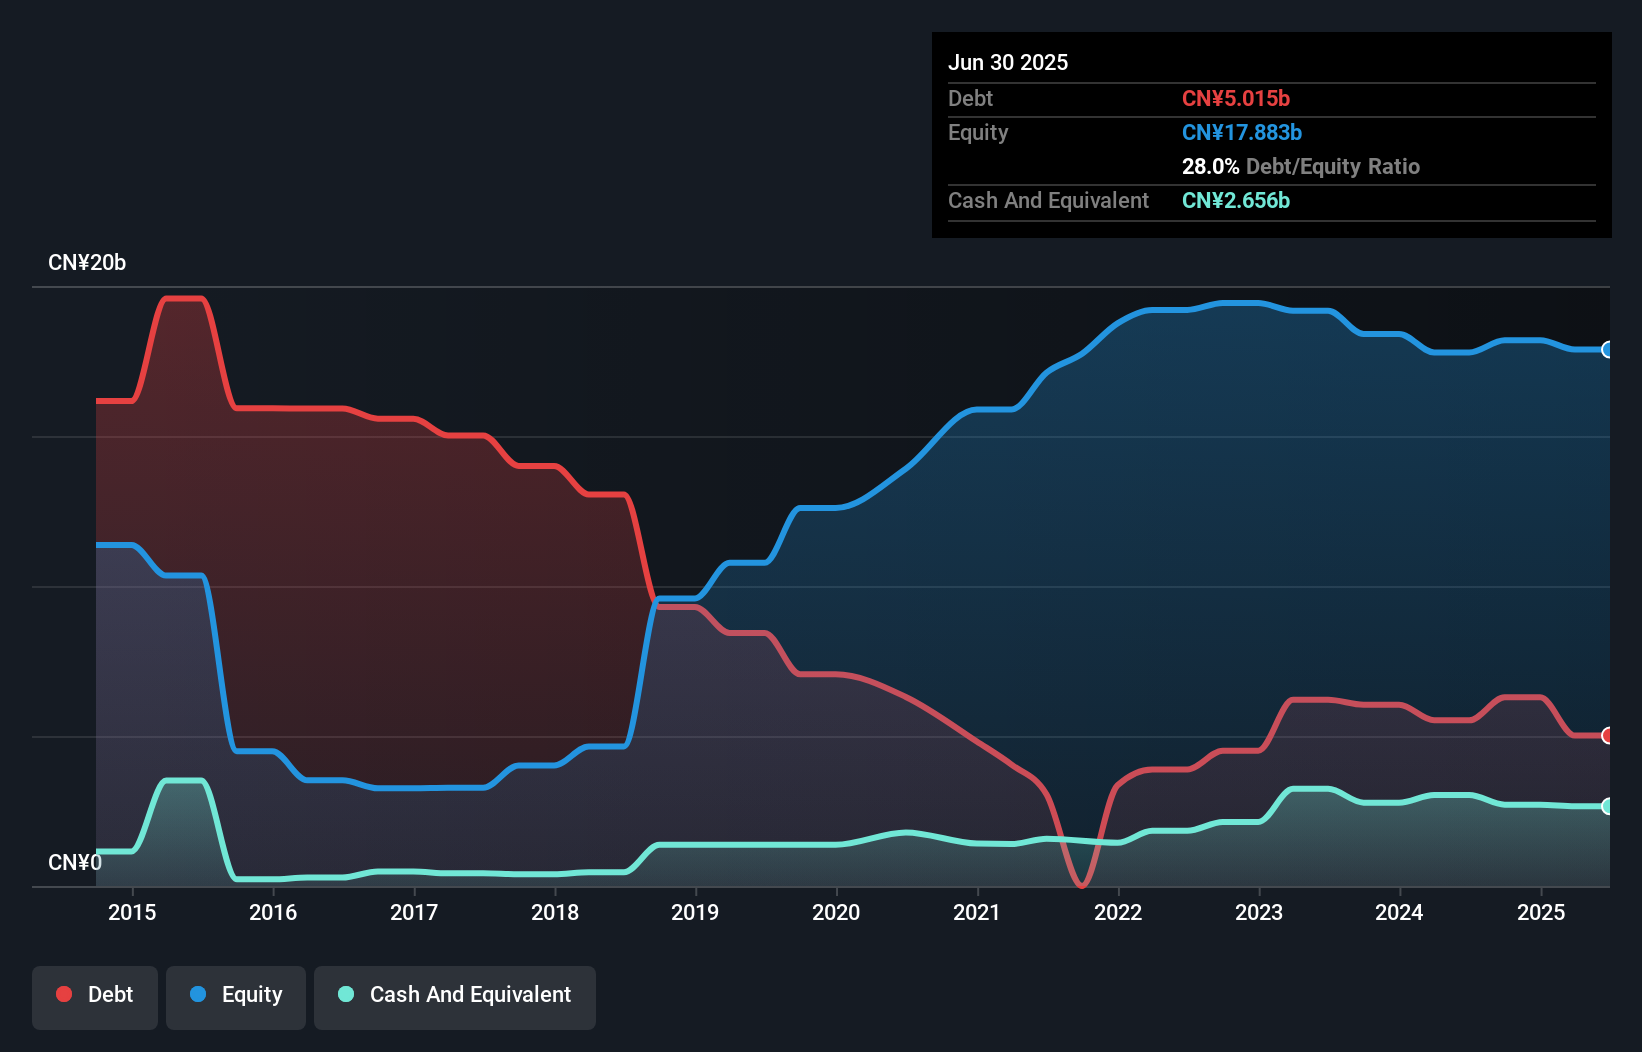
Guizhou Xinbang Pharmaceutical Co., Ltd. has demonstrated robust financial management, reducing its debt to equity ratio significantly over the past five years and maintaining more cash than total debt. The company's earnings growth of 79.4% in the past year outpaces industry averages, supported by improved net profit margins from 1.3% to 2.8%. Short-term assets of CN¥4.8 billion comfortably cover both short and long-term liabilities, enhancing financial stability despite a low return on equity at 3.3%. Recent earnings reports show a decline in sales but an increase in net income, reflecting operational efficiency improvements amidst market challenges.
- Click here to discover the nuances of Guizhou Xinbang Pharmaceutical with our detailed analytical financial health report.
- Learn about Guizhou Xinbang Pharmaceutical's historical performance here.

Key Takeaways
- Unlock our comprehensive list of 1,099 Asian Penny Stocks by clicking here.
- Searching for a Fresh Perspective? Outshine the giants: these 20 early-stage AI stocks could fund your retirement.
This article by Simply Wall St is general in nature. We provide commentary based on historical data and analyst forecasts only using an unbiased methodology and our articles are not intended to be financial advice. It does not constitute a recommendation to buy or sell any stock, and does not take account of your objectives, or your financial situation. We aim to bring you long-term focused analysis driven by fundamental data. Note that our analysis may not factor in the latest price-sensitive company announcements or qualitative material. Simply Wall St has no position in any stocks mentioned.
Have feedback on this article? Concerned about the content? Get in touch with us directly. Alternatively, email editorial-team@simplywallst.com