
Will Simplex Holdings (TSE:4373) Stock Outrun Slower Q2 Earnings Growth?
Simplex Holdings came into this Q2 2027 report with a premium tag, trading on a trailing P/E above the broader Japan IT sector, and recent one year earnings growth running well below its five year clip. The stock closed at ¥1,157 on 29 October, after a weak 7 day stretch where the price slipped about 9.8%. Yet the fresh quarter shows a cleaner story. Revenue reached ¥16,987m and basic earnings per share landed at ¥11.42, both pointing to a business still putting up solid profit in spite of that softer share move.
Impressed that Simplex Holdings is still putting up earnings at this P/E but wary of paying a premium when recent growth trails the longer term pace? Benchmark it against a curated set of resilient, lower risk ideas through our 26 resilient stocks with low risk scores.
Q2 2027 Earnings Summary
- Revenue (Q2 2027 vs. Q2 2026): ¥16,987m vs. ¥14,337m (up about 18.5%)
- Net Income, excl. extra items (Q2 2027 vs. Q2 2026): ¥2,561m vs. ¥2,618m (down about 2.2%)
- Basic EPS (Q2 2027 vs. Q2 2026): ¥11.42 vs. ¥11.51 (down about 0.8%)
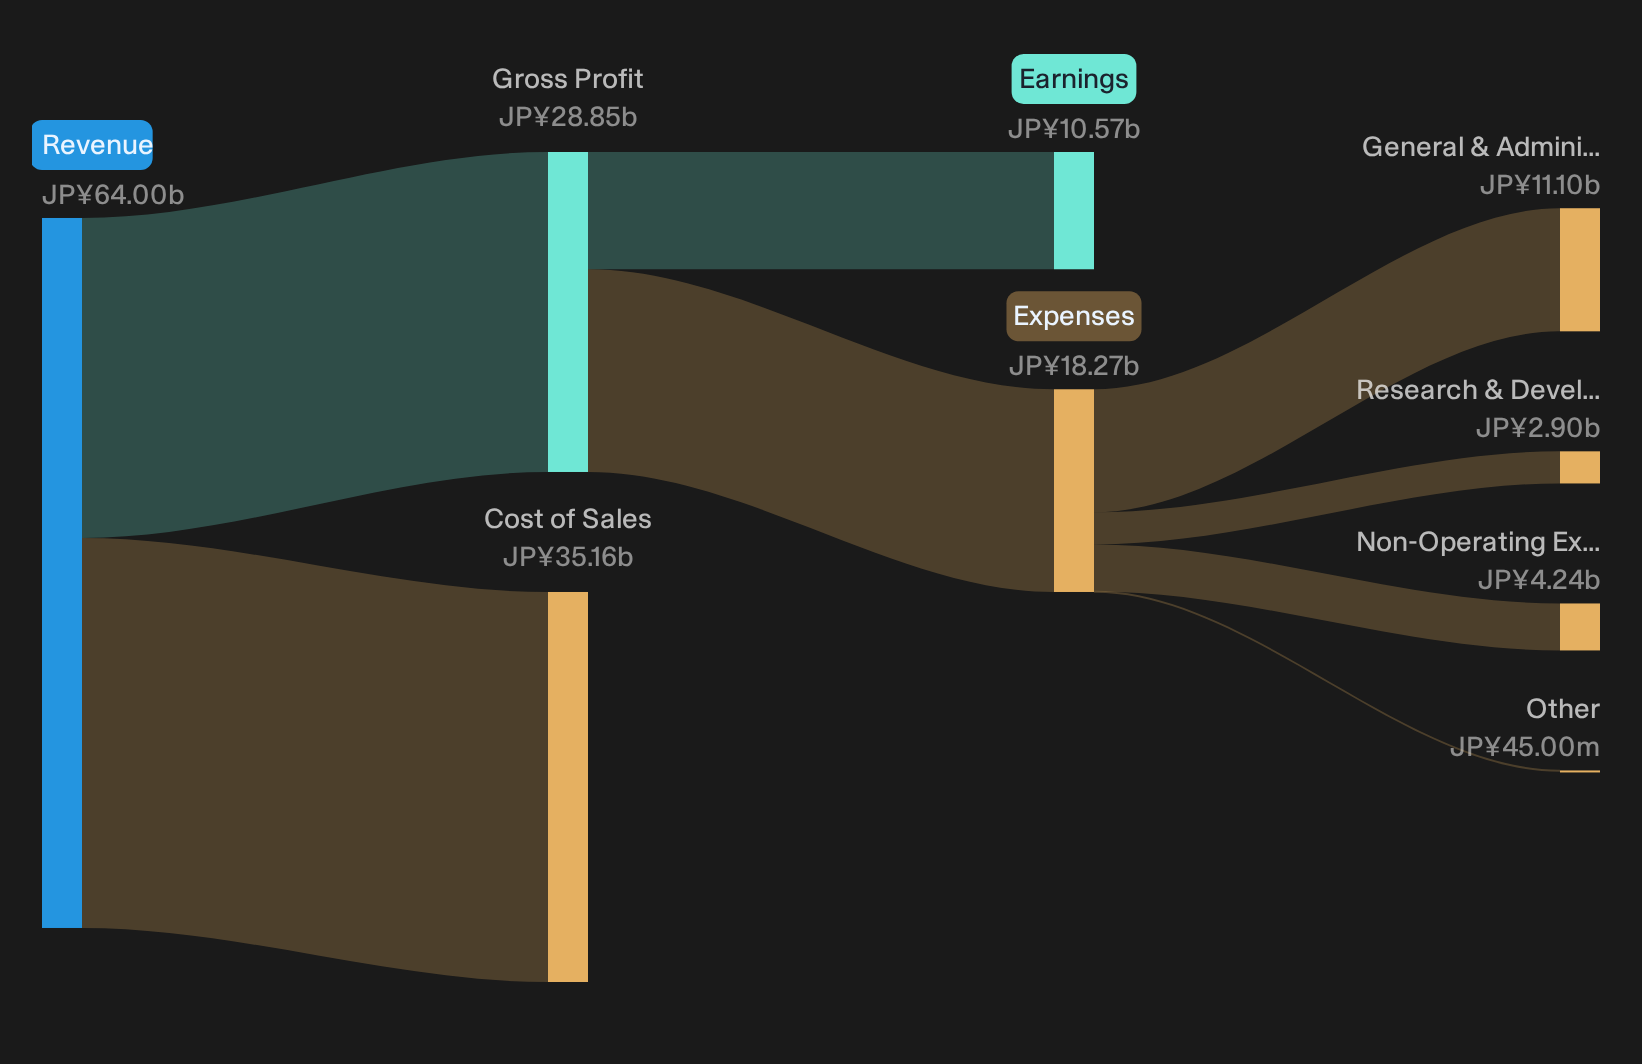
- Trailing 12 month net income, excl. extra items (Q2 2027 vs. Q2 2026): ¥10,571m vs. ¥9,964m (up about 6.1%)
Ask Charlie which risk Simplex Holdings’ rich valuation highlights.
Simplex bullish story leans on resilient revenue mix
Simplex Holdings still gives bulls something to work with. Top line climbed from ¥14,337m to ¥16,987m, which points to healthy demand for consulting and DX style work even as sentiment around the stock has softened recently. Trailing 12 month net income, excluding extra items, moved from ¥9,964m to ¥10,571m, so earnings power on a yearly view is not breaking down. For anyone arguing this is a steady DX infrastructure partner rather than a flashy growth play, these numbers broadly support that view.
Profit drift keeps Simplex downside debate alive
The bearish narrative is not without support. Quarterly net income excluding extra items eased from ¥2,618m to ¥2,561m and basic EPS slipped from ¥11.51 to ¥11.42. Profitability in the latest quarter is treading water while the share price fell about 9.8% over seven days into 29 October, with only low single digit gains over 30 and 90 days. For investors who already saw Simplex as a solid but unexciting IT integrator, this mix of stronger sales but softer quarterly earnings will not fully clear those doubts.
With margins already softer and the Simplex Holdings share price hugging a premium P/E, you should verify whether liquidity, leverage and cash generation genuinely support this valuation. Analyze the full balance sheet and cash flow picture in the financial health analysis of Simplex Holdings stock.Hunt For Mispriced Cash Generators
Simplex Holdings just showed how a steady business and a shifting share price can tell two slightly different stories. The real opportunity is finding stocks that could be undervalued before the market corrects them.
- Company 1 - 21% below our estimate - sells the data and reporting tools enterprises use as scattered spreadsheets start breaking workflows.
- Company 2 - 49% below our estimate - supplies the molding equipment brand owners adopt when they standardize bottle production across product lines.
- Company 3 - 23% below our estimate - provides the grinding and ceramic components manufacturers install when they upgrade precision and reliability on older production lines.
Three companies from the same screener. Open the full list of 15 companies trading below our fair value estimates →
Have feedback on this article? Concerned about the content? Get in touch with us directly. Alternatively, email editorial-team@simplywallst.com