
Natural Resource Partners (NRP) Could Be 44% Below Fair Value On Royalty Momentum
Natural Resource Partners (NRP) has drawn fresh attention after its units returned 20.2% over the past year, supported by a business model built on mineral royalties and exposure to the soda ash market.
Recent trading has been constructive for Natural Resource Partners, with a 30 day share price return of 7.13% and a 90 day share price gain of 19.15%. This points to building momentum around its $117.53 unit price.
Scan royalty-driven and mineral-focused opportunities that are moving on similar momentum to Natural Resource Partners by checking our hand picked list of 33 best rare earth metal stocks.
Bulls see Natural Resource Partners as a cash rich royalty platform, while bears see a coal exposed income stream facing structural pressure. Which case matches the current valuation after this latest run?
Price-to-Earnings of 14.9x: Is it justified?
On recent numbers, Natural Resource Partners trades on a P/E of 14.9x, which sits above the wider US Oil and Gas industry average of 12.4x even though the units last closed at $117.53 and screen as 43.9% below an internal fair value estimate based on future cash flows of $209.41.
The P/E ratio compares today’s unit price with the partnership’s earnings per unit and gives a quick sense of how much investors are paying for each dollar of profit. For a royalty focused mineral owner like Natural Resource Partners, that lens ties directly to how durable investors believe those cash distributions and royalty streams will be across coal, soda ash and other minerals.
There is a split message here. The SWS DCF model flags NRP as trading below an estimated future cash flow value of $209.41, which implies the market price may not fully reflect projected royalty cash flows. At the same time, the 14.9x P/E sits above the sector’s 12.4x average but well below a 29.4x peer group figure. That combination suggests investors in this partnership are paying more than the broad Oil and Gas industry multiple yet less than closer royalty and mineral peers, with the valuation leaning more on long term cash generation than on recent earnings momentum, especially given earnings fell 26.1% over the past year and net profit margins moved from 64.5% to 52.3%.
Against the broader industry, the comparison is sharp. Natural Resource Partners trades on a richer P/E than the US Oil and Gas average of 12.4x, which points to a premium being placed on its mineral and royalty model. Yet the units are described as good value when stacked against a 29.4x peer average and are indicated as 43.9% below a modeled fair value based on discounted future cash flows, placing a spotlight on how investors weigh coal exposure, soda ash participation and the quality of those earnings streams.
See what the numbers say about this price — find out in our valuation breakdown.
Result: Price-to-Earnings of 14.9x (ABOUT RIGHT)
Still, the narrative around Natural Resource Partners can shift quickly if coal royalty volumes soften or if soda ash pricing comes under sustained pressure.
Find out about the key risks to this Natural Resource Partners narrative.
Another View: Cash Flow Says Natural Resource Partners Looks Cheap
The share based P/E story presents Natural Resource Partners as only slightly rich versus the broader US Oil and Gas group. A different picture appears when the SWS DCF model is used. At $117.53 units trade 43.9% below a future cash flow estimate of $209.41, which indicates a material gap between price and modeled royalties.
That gap matters for you because P/E focuses on recent profit, while discounted cash flow centers on the stream of royalty payments over time. If the DCF assumptions on coal volumes and soda ash royalties hold, an important question is whether the current unit price fully reflects that potential cash pool.
Look into how the SWS DCF model arrives at its fair value.
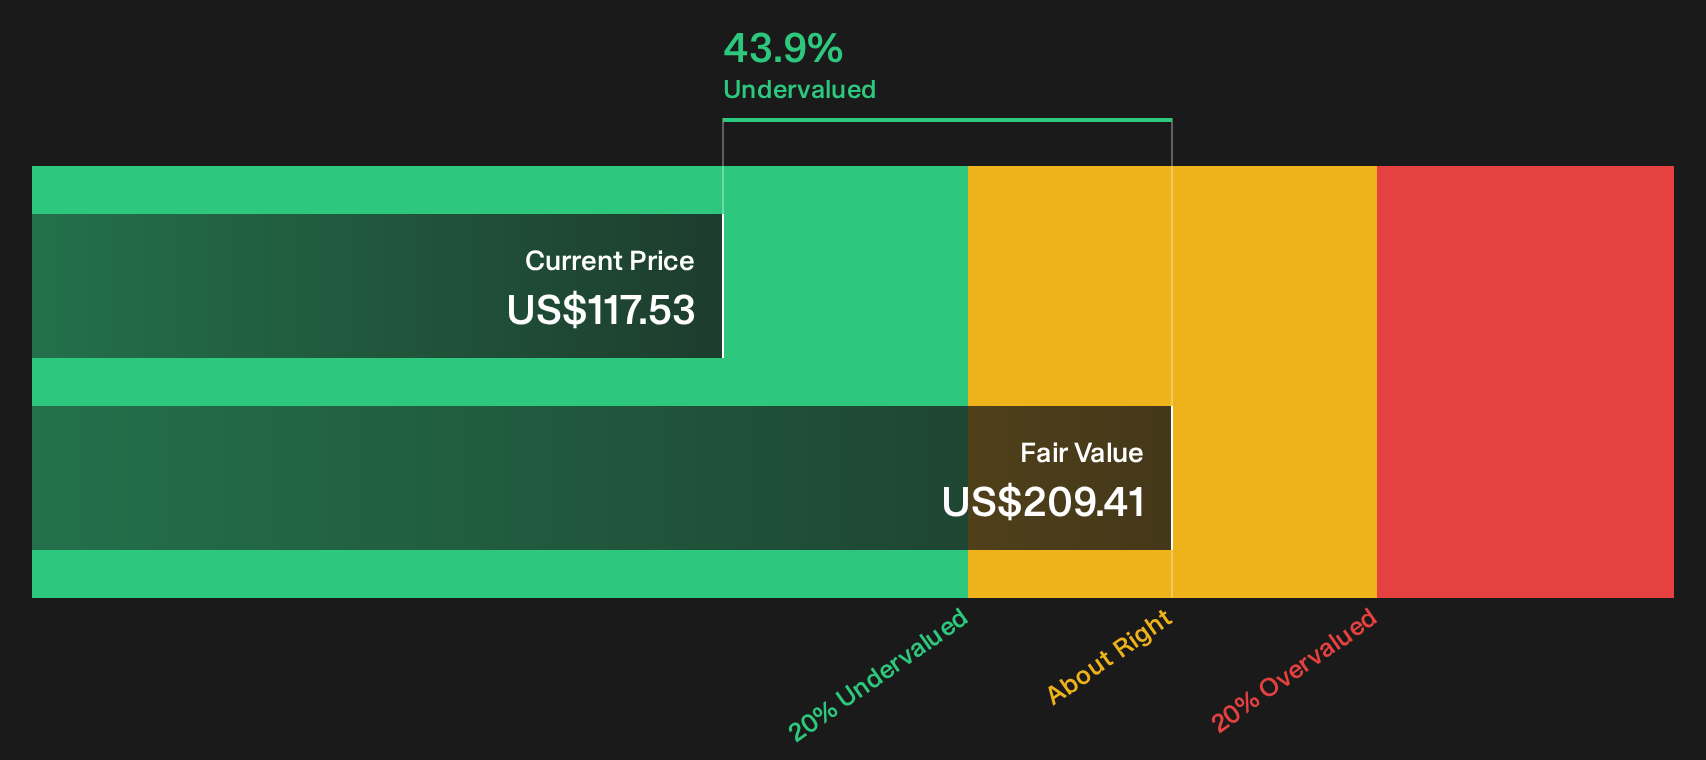
Simply Wall St performs a discounted cash flow (DCF) on every stock in the world every day (check out Natural Resource Partners for example). We show the entire calculation in full. You can track the result in your watchlist or portfolio and be alerted when this changes, or use our stock screener to discover 26 high quality undervalued stocks. If you save a screener we even alert you when new companies match - so you never miss a potential opportunity.
Next Steps
Feeling torn between the upbeat cash flow story and the coal and soda ash uncertainty around Natural Resource Partners? Move fast, review the full data set, and pressure test both sides of the argument by weighing the 1 key reward and 2 important warning signs
Looking for more investment ideas beyond Natural Resource Partners?
If Natural Resource Partners has you thinking differently about royalties and cash flow, do not stop there. Broaden your watchlist with focused ideas built from hard numbers.
- Target resilience by evaluating companies that show lower risk scores and steadier profiles through our 32 resilient stocks with low risk scores.
- Hunt for value by reviewing a curated set of companies that look attractively priced on quality and fundamentals through the 26 high quality undervalued stocks.
- Spot potential hidden opportunities by checking a focused group of stronger fundamental businesses that fly under most radars in the 19 high quality undiscovered gems.
Have feedback on this article? Concerned about the content? Get in touch with us directly. Alternatively, email editorial-team@simplywallst.com