
3 Oil And Gas Stocks Most Exposed To Strait Of Hormuz Disruption
Oil majors are back in the spotlight as the Iran–US war disrupts flows through the Strait of Hormuz, squeezes Iranian exports and reshapes risk across global energy markets. Price swings, shifting trade routes and sanctions can reward some stocks and hurt others, often faster than headlines suggest. This article unpacks the story and examines 3 integrated oil and gas giants that appear most exposed to these shocks right now.
The three stocks covered next are just a sample set, and the full screen surfaced 27 more global integrated oil and gas majors with equally compelling stories that are not discussed here. If you want to identify and analyze the wider field of large integrated producers, go straight to the Global Integrated Oil & Gas Majors screener.
Tidewater Midstream and Infrastructure (TSX:TWM)
Overview: Tidewater Midstream and Infrastructure processes, transports, stores and refines natural gas, liquids, crude, fuels and renewable products across Western Canada and the US, giving the stock direct exposure to integrated oil and refining activity that underpins this screener’s focus on large, system-critical energy operators.
Market Cap: CA$531 million
Tidewater Midstream and Infrastructure gives you exposure to the plumbing of the energy system, where reliability of processing and refined product output can matter as much as headline oil prices when Middle East supply routes are under strain.
"Although policy incentives support higher renewable diesel throughput at Tidewater Midstream and Infrastructure, the recent 8% decline in BRC gas processing volumes and the move from 90% to 76% fractionation utilization indicate that pipeline curtailments can quickly pull midstream revenue and earnings below what high-level demand assumptions imply."
The real swing factor for Tidewater Midstream and Infrastructure is what happens if a single key assumption about future policy support shifts.
If that policy assumption really is the hinge, read the full narrative for Tidewater Midstream and Infrastructure to see how shifting incentives, volumes and capital plans could be decoupling.

Reliance Industries (NSEI:RELIANCE)
Overview: Reliance Industries runs a large integrated energy and materials operation, with refining, petrochemicals and upstream oil and gas wrapped inside a wider retail and digital conglomerate.
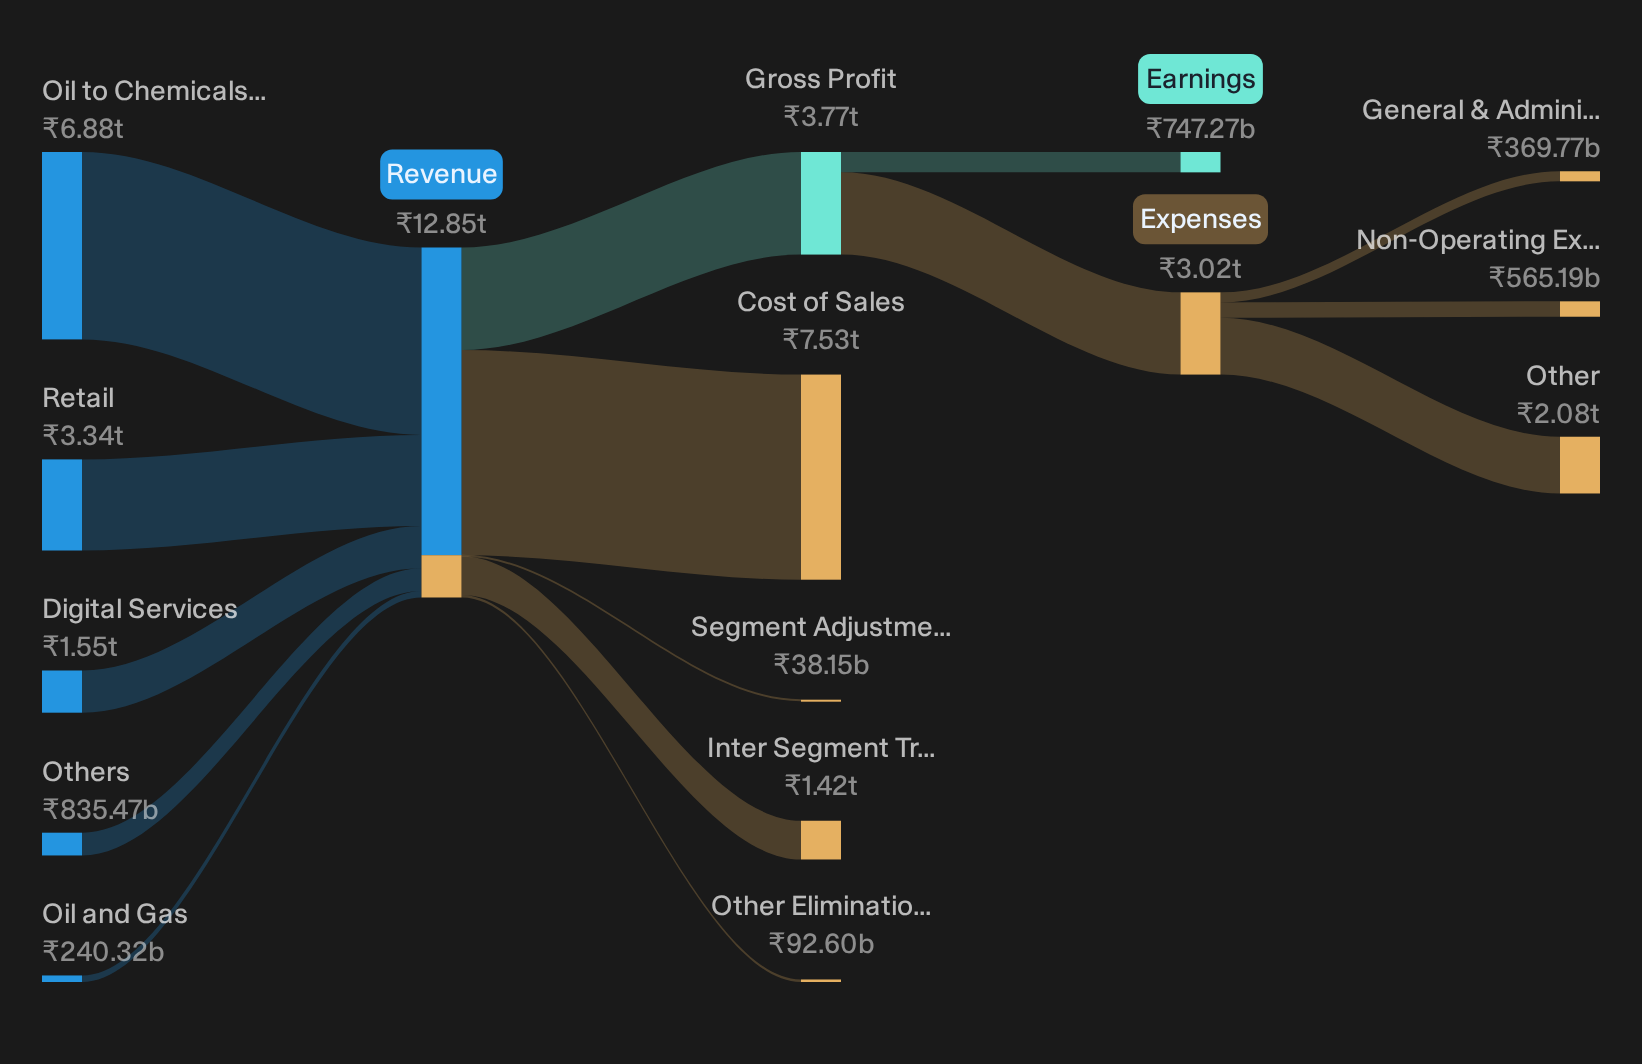
Operations: Reliance generates most of its revenue from Oil to Chemicals at about ₹6,879.7b, with sizeable contributions from Retail at ₹3,344.4b and Digital Services at ₹1,549.2b.
Market Cap: ₹16,187.6b
Reliance Industries matters for this integrated oil and gas majors screen because its refineries and petrochemicals complex sit at the point where crude supply shocks, fuel demand and product pricing all meet.
"The company's highly integrated, proprietary digital technology stack and rapid 5G deployment position Reliance Jio to capture ongoing growth in India's large digitization wave."
What happens to Reliance Industries’ earnings profile if a single assumption about how quickly these newer cash engines scale does not hold?
If that scaling risk worries you, read the full narrative for Reliance Industries to see whether Reliance Industries' maturing cash engines are accelerating, stalling, or quietly masking future volatility.
OMV Petrom (BVB:SNP)
Overview: OMV Petrom is a Romanian integrated energy group that explores for oil and gas, refines crude into fuels, and sells power and petroleum products across the region.
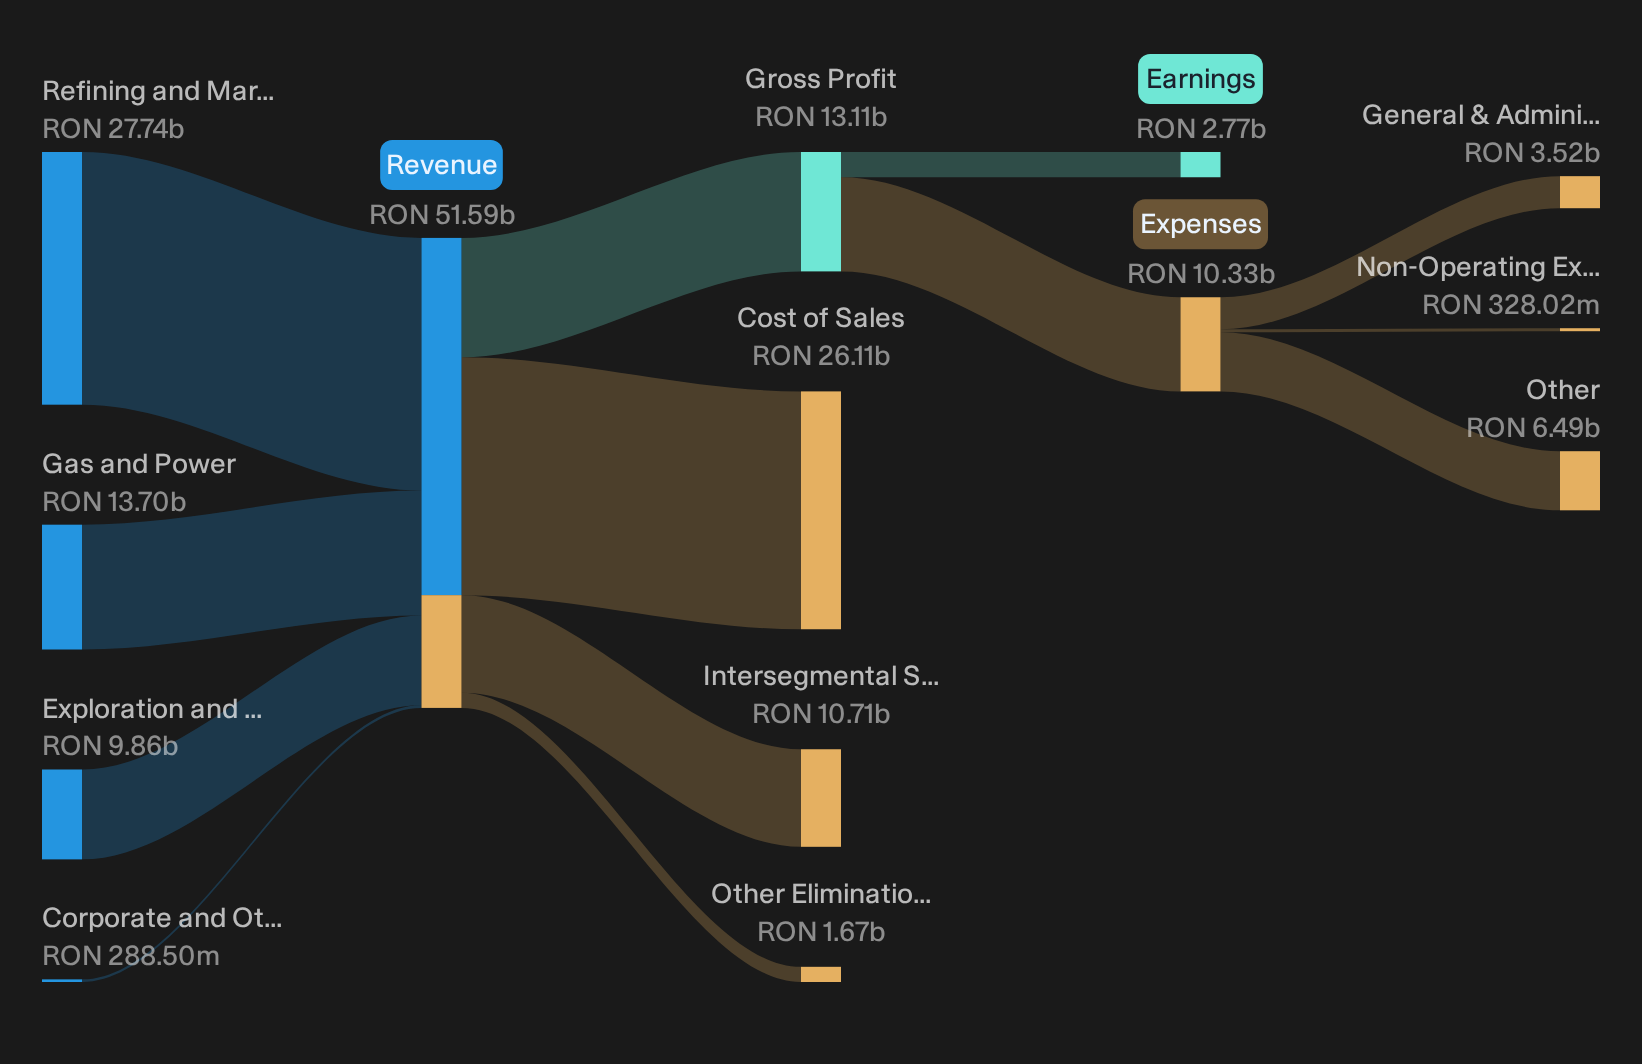
Operations: OMV Petrom generates most of its revenue from Refining and Marketing at about RON27.7b, with material contributions from Exploration and Production at roughly RON9.9b and Gas and Power at about RON13.7b.
Market Cap: RON82.6b
OMV Petrom sits squarely in the integrated majors bracket for this screen, tying together Romanian upstream fields, Petrobrazi refining and a growing gas and power arm at a time when supply risk in the Gulf is sharpening the value of resilient regional fuel and electricity flows.
"Progress at the Neptun Deep Black Sea gas project remains on track and is expected to materially increase OMV Petrom’s production volumes, reduce unit production costs and lower E&P cash flow breakeven towards about US$30 per barrel of oil equivalent. This feeds directly into future EBIT and cash flow expectations that may already be priced in."
What happens to OMV Petrom’s margin story if a single assumption about how that future cash engine performs no longer holds?
If that margin hinge point matters to you, read the full narrative for OMV Petrom to see whether OMV Petrom’s next leg is accelerating, stalling, or quietly decoupling from expectations.
Seeking Alternatives Beyond Oil Majors?
Fresh opportunities can move fast when money chases the next breakout and laggards keep dropping. Scan what is still under the radar for now and consider acting before conditions change.
- Identify income workhorses with staying power before yields potentially get compressed by demand using the 3 dividend fortresses that filters for businesses focused on sustaining cash flows and higher payouts.
- Review the next leg of the AI momentum theme by using the curated 39 profitable AI stocks that aren't just burning cash that highlights companies already generating earnings rather than relying mainly on long-term projections.
- Evaluate the shifting power landscape by exploring the targeted 42 power grid technology and infrastructure stocks that includes companies involved in grid upgrades, electrification, and long-cycle infrastructure projects.
Have feedback on this article? Concerned about the content? Get in touch with us directly. Alternatively, email editorial-team@simplywallst.com