
Is Baycurrent (TSE:6532) Still Worth Its Premium After Half Year Results And A Higher Dividend?
Baycurrent (TSE:6532) just released its latest figures, reporting half-year sales of ¥92,913 million and net income of ¥22,209 million, along with a higher second-quarter dividend of ¥65 per share.
That higher half-year dividend and the latest figures land at a time when Baycurrent’s share price has surged, with a 30-day share price return of 48.74% and a year-to-date share price gain of 76.92%, while the three-year total shareholder return of 200.45% points to momentum that has been building over a longer stretch.
Scan how Baycurrent’s earnings and dividend news compares with other potential opportunities by reviewing our hand picked 72 high quality undiscovered gems that also pair strong fundamentals with current market interest.
After Baycurrent’s sharp re rating and richer dividend, the crucial issue is whether recent buyers already captured the bulk of the benefit or if the current price still leaves clear upside on the table.
Price-to-Earnings of 39x: Is it justified?
Baycurrent now trades on a P/E of 39x, and that richer tag sits well above both its professional services peers and where fair value estimates point.
The P/E ratio compares the current share price to earnings per share. For a consulting business like Baycurrent, it shows how much investors are willing to pay for each unit of profit, which often reflects expectations around future earnings growth and the perceived quality of those earnings.
Analysts flag that Baycurrent’s P/E of 39x is expensive relative to the JP Professional Services industry average of 13.2x and also higher than the peer average of 17.2x. Compared to an estimated fair P/E of 29.7x, the current multiple looks stretched. That fair ratio level is a point the market could move towards if expectations cool.
Explore the SWS fair ratio for Baycurrent.
Result: Price-to-Earnings of 39x (OVERVALUED)
Still, any reversal in Baycurrent’s sharp share price gains, or a pullback in consulting demand, could quickly challenge confidence in that premium P/E multiple.
Find out about the key risks to this Baycurrent narrative.
Another View on Baycurrent’s Value
The headline P/E of 39x makes Baycurrent look expensive, yet our DCF model points in a different direction. On that framework, the shares trade around ¥11,355 compared with an estimated future cash flow value of about ¥14,509.32, suggesting the market price sits below that cash flow based yardstick.
This kind of gap can cut both ways. It can signal a cushion if growth holds up or warn that the model is baking in quite a lot of success. The real question for you is which signal feels more fragile: the premium P/E or the DCF support underneath it.
Look into how the SWS DCF model arrives at its fair value.
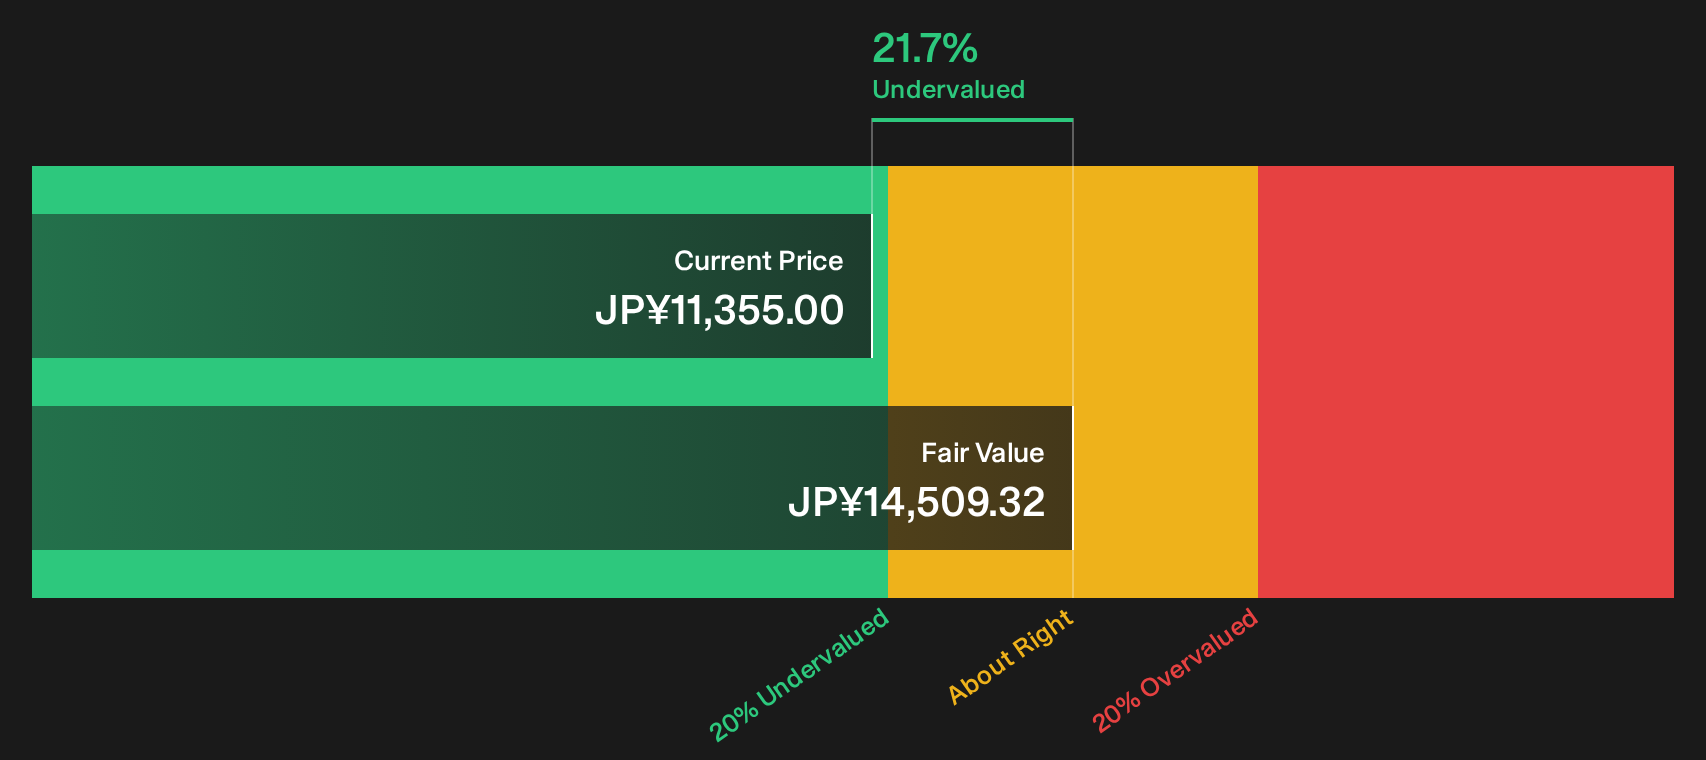
Simply Wall St performs a discounted cash flow (DCF) on every stock in the world every day (check out Baycurrent for example). We show the entire calculation in full. You can track the result in your watchlist or portfolio and be alerted when this changes, or use our stock screener to discover 16 high quality undervalued stocks. If you save a screener we even alert you when new companies match - so you never miss a potential opportunity.
Next Steps
Plenty in Baycurrent’s recent run will excite some readers and worry others, so treat this as a prompt to act fast, test the numbers yourself, and then weigh both sides of the story through 3 key rewards and 1 important warning sign
Looking for more Baycurrent sized investment ideas?
If Baycurrent has sharpened your focus, do not stop here. Broaden your watchlist now so you are not catching up after the next big move.
- Target resilient cash generators by scanning a list of solid balance sheet and fundamentals (23 results) that filters for companies combining sturdy finances with fundamental strength.
- Hunt for mispriced quality through a 16 high quality undervalued stocks that highlights businesses where fundamentals and current pricing look out of sync.
- Dial back portfolio stress by reviewing a 22 resilient stocks with low risk scores focused on stocks with lower risk scores and steadier profiles.
Have feedback on this article? Concerned about the content? Get in touch with us directly. Alternatively, email editorial-team@simplywallst.com