
KandenkoLtd (TSE:1942) Has Slipped Recently, Is It Trading Below Fair Value?
KandenkoLtd (TSE:1942) has drawn fresh attention after recent trading saw the share price decline about 10% over the past month and roughly 16% in the past 3 months.
Viewed over a longer stretch, KandenkoLtd’s short-term weak share price momentum, including the recent 10% monthly fall, contrasts with a much stronger picture for long-term investors. The 1-year total shareholder return is 14.71%, and the 5-year result is described as extremely high.
Scan how KandenkoLtd compares with other construction and infrastructure contractors under pressure and see which peers have stronger momentum using our hand picked 42 power grid technology and infrastructure stocks
KandenkoLtd’s slide has opened a gap between recent weakness and solid multi year returns. Is that a reasonable entry point now, or does it make more sense to wait for a clearer valuation cushion?
Price-to-Earnings of 15.8x: Is it justified?
KandenkoLtd now trades on a P/E of 15.8x, which looks rich beside both its construction industry and peer averages, even after the recent share price pullback to ¥5,085.
The P/E ratio compares what investors pay for each unit of earnings. For a contractor like KandenkoLtd, it often reflects how confident the market feels about future profit resilience and project quality rather than just the last set of results.
Here the market is assigning a higher tag to those earnings. KandenkoLtd is described as expensive versus the JP Construction industry average P/E of 10.3x and also compared with the peer group average of 12.2x. This signals that investors are willing to pay a clear premium multiple. Yet the estimated fair P/E for the business is 19.2x, so the current 15.8x level sits well below that reference point and highlights a sizeable valuation gap that the multiple could move towards if the story holds together.
Explore the SWS fair ratio for KandenkoLtd.
Result: Price-to-Earnings of 15.8x (OVERVALUED)
Still, the premium P/E rests on continued earnings delivery, and any setback in large facility projects or a pause in Japan-focused construction demand could challenge that optimism.
Find out about the key risks to this KandenkoLtd narrative.
Another view using cash flows
The earnings multiple paints KandenkoLtd as expensive, yet the SWS DCF model points the other way. At ¥5,085, the stock is described as trading about 5.1% below an estimated future cash flow value of roughly ¥5,356. That raises a simple question: Which signal matters more for you, the earnings tag or the cash flow math?
Look into how the SWS DCF model arrives at its fair value.
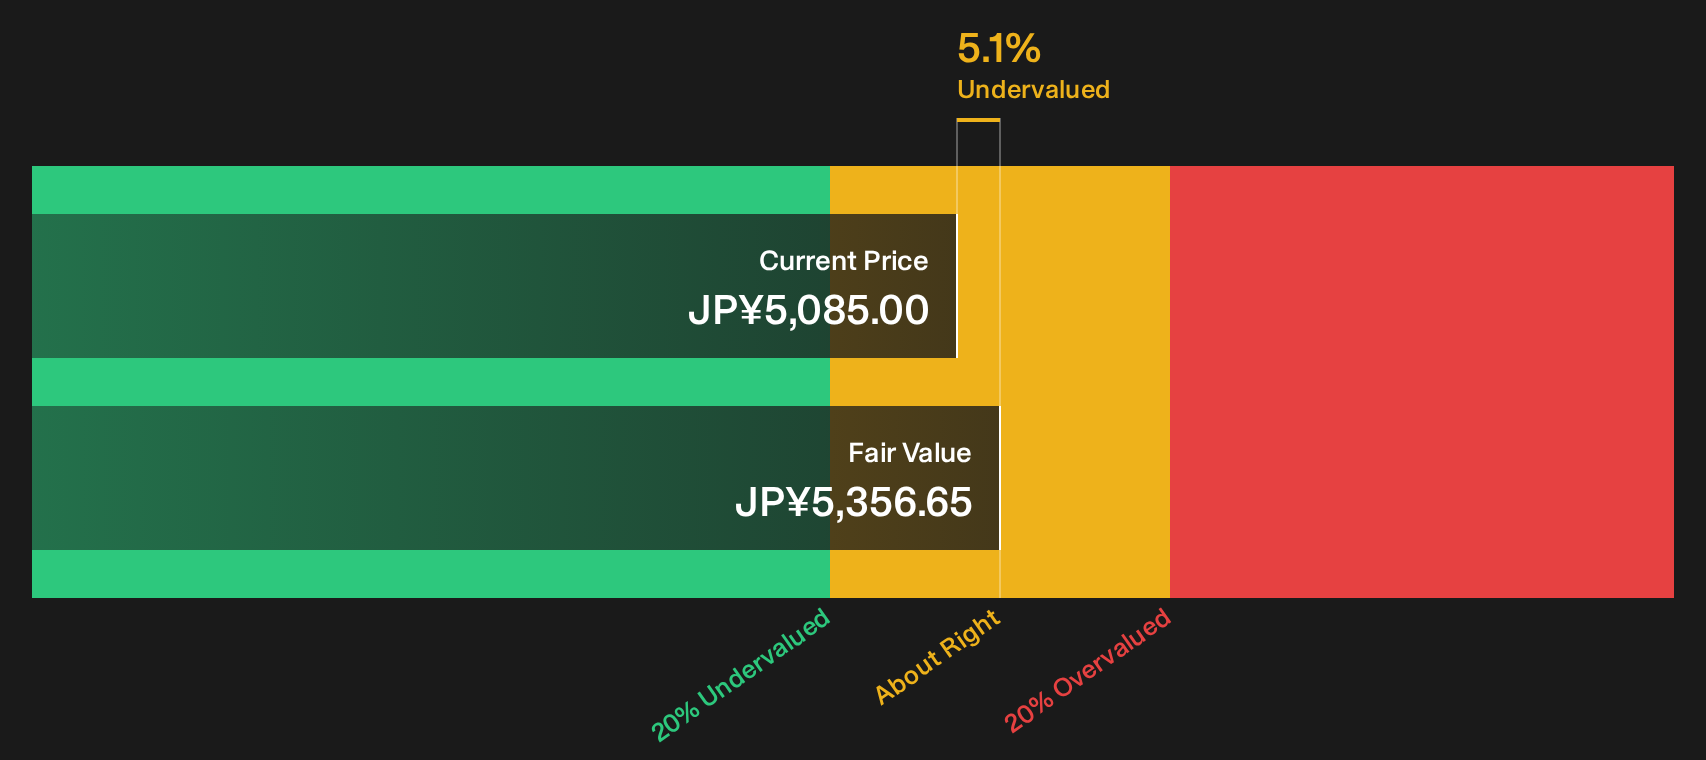
Simply Wall St performs a discounted cash flow (DCF) on every stock in the world every day (check out KandenkoLtd for example). We show the entire calculation in full. You can track the result in your watchlist or portfolio and be alerted when this changes, or use our stock screener to discover 14 high quality undervalued stocks. If you save a screener we even alert you when new companies match - so you never miss a potential opportunity.
Next Steps
Pricing looks stretched, but does the recent pullback shift the balance of risks and rewards in your view, or not yet? Act quickly and test your own thesis by weighing the potential upside flagged in our breakdown of 5 key rewards
Looking for more KandenkoLtd style investment ideas?
If KandenkoLtd has sharpened your focus on pricing and quality, there is a bigger universe of ideas worth lining up before you commit fresh capital.
- Target resilient payout streams by scanning these potential income anchors through our 29 dividend fortresses.
- Hunt for mispriced quality by running a quick check across the 72 high quality undiscovered gems that might not be on every investor’s radar yet.
- Reduce portfolio stress by filtering for companies that our tools flag as 22 resilient stocks with low risk scores.
Have feedback on this article? Concerned about the content? Get in touch with us directly. Alternatively, email editorial-team@simplywallst.com