
- PREMIUM
- LIVE QUOTES
- INSTITUTION
 Index Options
 State Street
 CME Group
 Nasdaq
 Cboe
Cboe TradingView
 Wall Street Journal
Assessing MNTN (MNTN)’s Valuation After a Sharp Momentum Slowdown
MNTN (MNTN) has quietly slipped over the past month, but its latest reported results tell a more nuanced story, with revenue growth positive while profits remain negative. That mix sets up an interesting risk reward profile.
See our latest analysis for MNTN.
Those weak recent numbers line up with the share price narrative, with the stock down sharply. The 90 day share price return is 34.7 percent and the year to date share price return is 50.5 percent, suggesting momentum is clearly fading for now.
If MNTN’s slump has you rethinking your exposure to ad tech, it might be time to explore fast growing stocks with high insider ownership as potential higher conviction ideas.
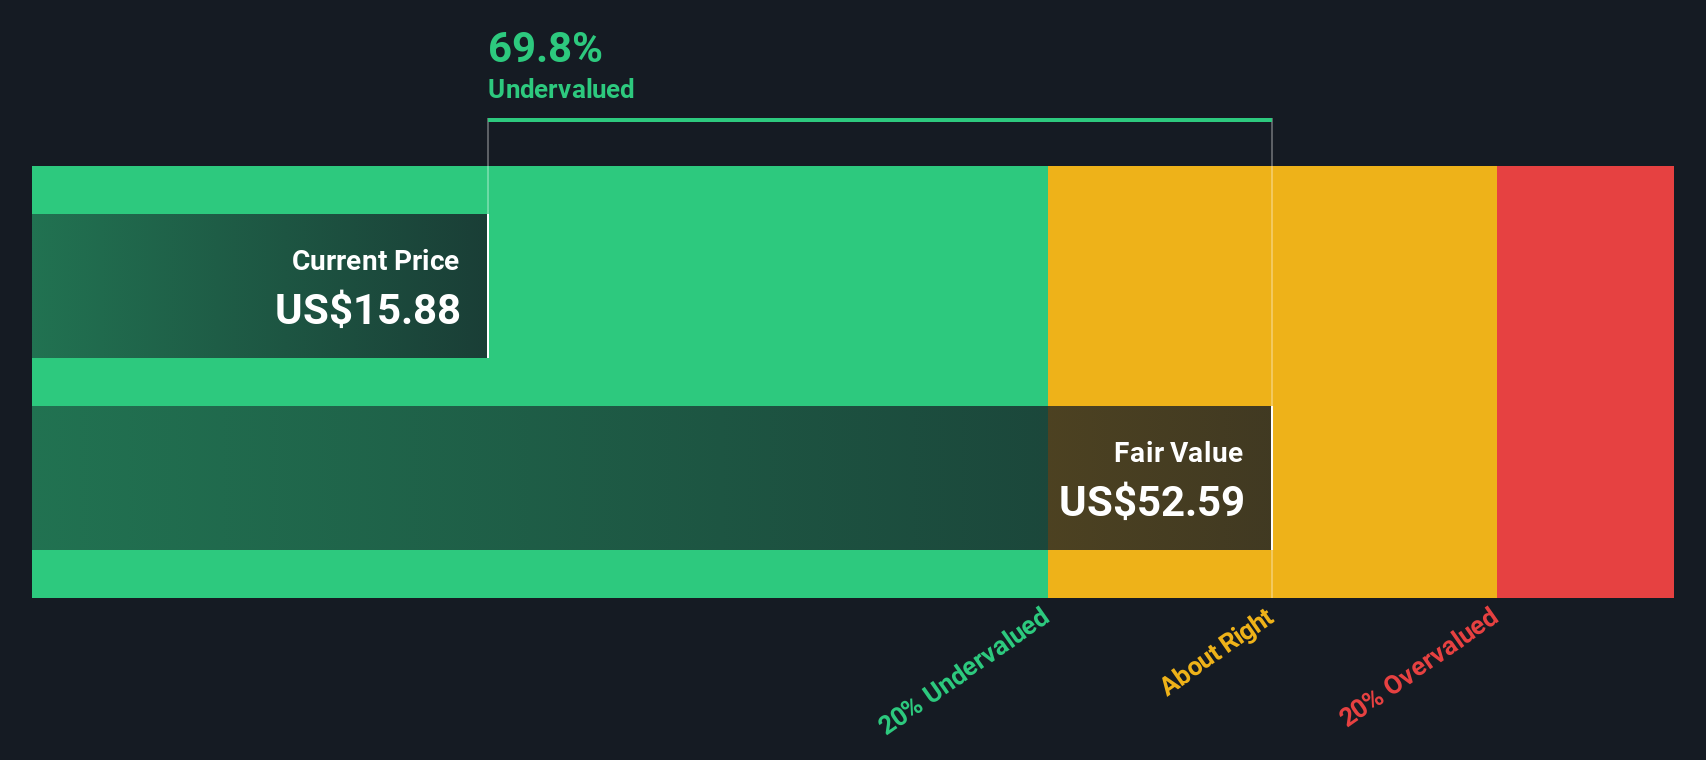
With the share price now more than 70 percent below some valuation estimates but profitability still elusive, the key question is whether investors are being offered a mispriced growth asset, or if the market is already discounting future upside.
Price to Sales of 3.5x: Is It Justified?
MNTN shares change hands at a rich valuation on revenue, with a 3.5x price to sales ratio that looks stretched next to peers and fair value estimates.
The price to sales multiple compares the company’s market value to the revenue it generates, a common yardstick for high growth, loss making platform businesses where earnings are not yet meaningful.
In MNTN’s case, the market is assigning a revenue multiple more than double the peer average of 1.6x and more than the estimated fair price to sales level of 2.1x, which implies that investors are still paying up for future operating leverage and margin expansion even as the stock has sold off.
That premium stands out against the broader US Media industry, where the average price to sales multiple is just 1x. It highlights how far the current valuation could compress if sentiment cools and the market leans back toward that lower, fairer revenue based ratio.
Explore the SWS fair ratio for MNTN
Result: Price to Sales of 3.5x (OVERVALUED)
However, investors should watch for slower ad spend on connected TV and prolonged losses, as either could justify a sharper reset in sentiment and valuation.
Find out about the key risks to this MNTN narrative.
Another View: What Does Our DCF Say?
While the 3.5x price to sales ratio makes MNTN look expensive, our DCF model paints a very different picture, implying fair value of around $51.24 per share versus the current $13.05. That deep 74.5 percent discount suggests upside, but is the growth story strong enough to close the gap?
Look into how the SWS DCF model arrives at its fair value.
Simply Wall St performs a discounted cash flow (DCF) on every stock in the world every day (check out MNTN for example). We show the entire calculation in full. You can track the result in your watchlist or portfolio and be alerted when this changes, or use our stock screener to discover 907 undervalued stocks based on their cash flows. If you save a screener we even alert you when new companies match - so you never miss a potential opportunity.
Build Your Own MNTN Narrative
If this perspective does not fully align with your own or you prefer digging into the numbers yourself, you can craft a complete narrative in under three minutes: Do it your way.
A great starting point for your MNTN research is our analysis highlighting 2 key rewards and 1 important warning sign that could impact your investment decision.
Looking for more investment ideas?
Before you move on, use the Simply Wall St Screener to uncover fresh opportunities that could outpace MNTN and strengthen your portfolio for the long term.
- Capture early stage growth potential by scanning these 3572 penny stocks with strong financials that already show solid financial underpinnings, not just hype.
- Capitalize on the AI revolution by targeting these 26 AI penny stocks positioned at the intersection of innovation, scalability, and accelerating demand.
- Lock in value opportunities by filtering for these 15 dividend stocks with yields > 3% that can boost your income stream while markets stay volatile.
This article by Simply Wall St is general in nature. We provide commentary based on historical data and analyst forecasts only using an unbiased methodology and our articles are not intended to be financial advice. It does not constitute a recommendation to buy or sell any stock, and does not take account of your objectives, or your financial situation. We aim to bring you long-term focused analysis driven by fundamental data. Note that our analysis may not factor in the latest price-sensitive company announcements or qualitative material. Simply Wall St has no position in any stocks mentioned.
Have feedback on this article? Concerned about the content? Get in touch with us directly. Alternatively, email editorial-team@simplywallst.com