
- PREMIUM
- LIVE QUOTES
- INSTITUTION
 Index Options
 State Street
 CME Group
 Nasdaq
 Cboe
Cboe TradingView
 Wall Street Journal
NGS Group (NGM:NGS) Has Some Difficulty Using Its Capital Effectively
What financial metrics can indicate to us that a company is maturing or even in decline? A business that's potentially in decline often shows two trends, a return on capital employed (ROCE) that's declining, and a base of capital employed that's also declining. Basically the company is earning less on its investments and it is also reducing its total assets. So after we looked into NGS Group (NGM:NGS), the trends above didn't look too great.
Return On Capital Employed (ROCE): What Is It?
If you haven't worked with ROCE before, it measures the 'return' (pre-tax profit) a company generates from capital employed in its business. The formula for this calculation on NGS Group is:
Return on Capital Employed = Earnings Before Interest and Tax (EBIT) ÷ (Total Assets - Current Liabilities)
0.014 = kr1.4m ÷ (kr144m - kr44m) (Based on the trailing twelve months to September 2025).
Thus, NGS Group has an ROCE of 1.4%. In absolute terms, that's a low return and it also under-performs the Healthcare industry average of 8.9%.
Check out our latest analysis for NGS Group
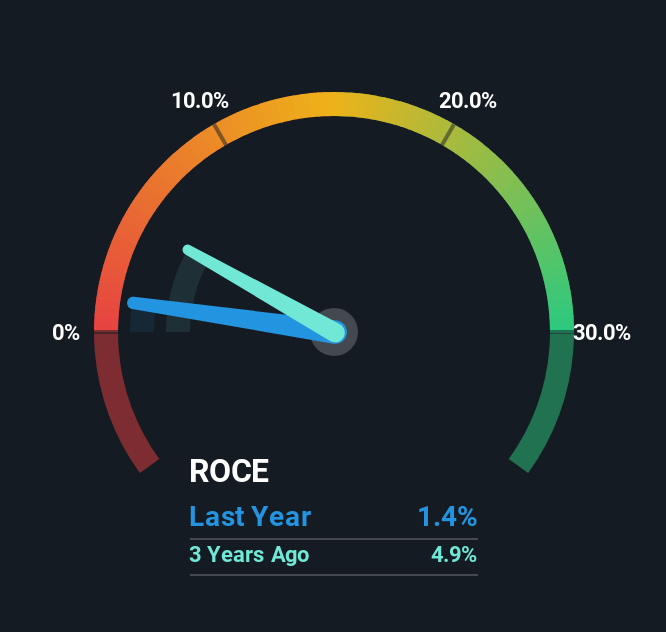
Historical performance is a great place to start when researching a stock so above you can see the gauge for NGS Group's ROCE against it's prior returns. If you'd like to look at how NGS Group has performed in the past in other metrics, you can view this free graph of NGS Group's past earnings, revenue and cash flow.
How Are Returns Trending?
The trend of returns that NGS Group is generating are raising some concerns. To be more specific, today's ROCE was 5.2% five years ago but has since fallen to 1.4%. What's equally concerning is that the amount of capital deployed in the business has shrunk by 57% over that same period. When you see both ROCE and capital employed diminishing, it can often be a sign of a mature and shrinking business that might be in structural decline. If these underlying trends continue, we wouldn't be too optimistic going forward.
The Bottom Line On NGS Group's ROCE
In short, lower returns and decreasing amounts capital employed in the business doesn't fill us with confidence. We expect this has contributed to the stock plummeting 79% during the last five years. Unless there is a shift to a more positive trajectory in these metrics, we would look elsewhere.
Since virtually every company faces some risks, it's worth knowing what they are, and we've spotted 4 warning signs for NGS Group (of which 3 are a bit concerning!) that you should know about.
If you want to search for solid companies with great earnings, check out this free list of companies with good balance sheets and impressive returns on equity.
Have feedback on this article? Concerned about the content? Get in touch with us directly. Alternatively, email editorial-team (at) simplywallst.com.
This article by Simply Wall St is general in nature. We provide commentary based on historical data and analyst forecasts only using an unbiased methodology and our articles are not intended to be financial advice. It does not constitute a recommendation to buy or sell any stock, and does not take account of your objectives, or your financial situation. We aim to bring you long-term focused analysis driven by fundamental data. Note that our analysis may not factor in the latest price-sensitive company announcements or qualitative material. Simply Wall St has no position in any stocks mentioned.