
- PREMIUM
- LIVE QUOTES
- INSTITUTION
 Index Options
 State Street
 CME Group
 Nasdaq
 Cboe
Cboe TradingView
 Wall Street Journal
Is It Too Late To Consider Ford After EV Strategy Shift And 35% Rally?
- If you are wondering whether Ford Motor at around $13 a share is still a value play or if the easy money has already been made, you are not alone. That is exactly what we are going to unpack here.
- Despite a dip of around 1.9% over the last week and 1.4% over the last month, Ford is still up 35.0% year to date and 33.2% over the past year, hinting that market sentiment has shifted meaningfully in its favor.
- Recent headlines around Ford have centered on its evolving electric vehicle strategy, from scaling back certain EV investments to focusing more on profitable truck and commercial segments, alongside ongoing negotiations and developments in labor and supply chain dynamics. Together, these moves have reshaped how investors think about Ford's long term growth path and risk profile.
- Right now, Ford scores a 3/6 valuation check score, suggesting the market may be underestimating it on several fronts. In the next sections we will compare different valuation approaches before ending with a more nuanced way to judge whether the stock still offers real value.
Approach 1: Ford Motor Discounted Cash Flow (DCF) Analysis
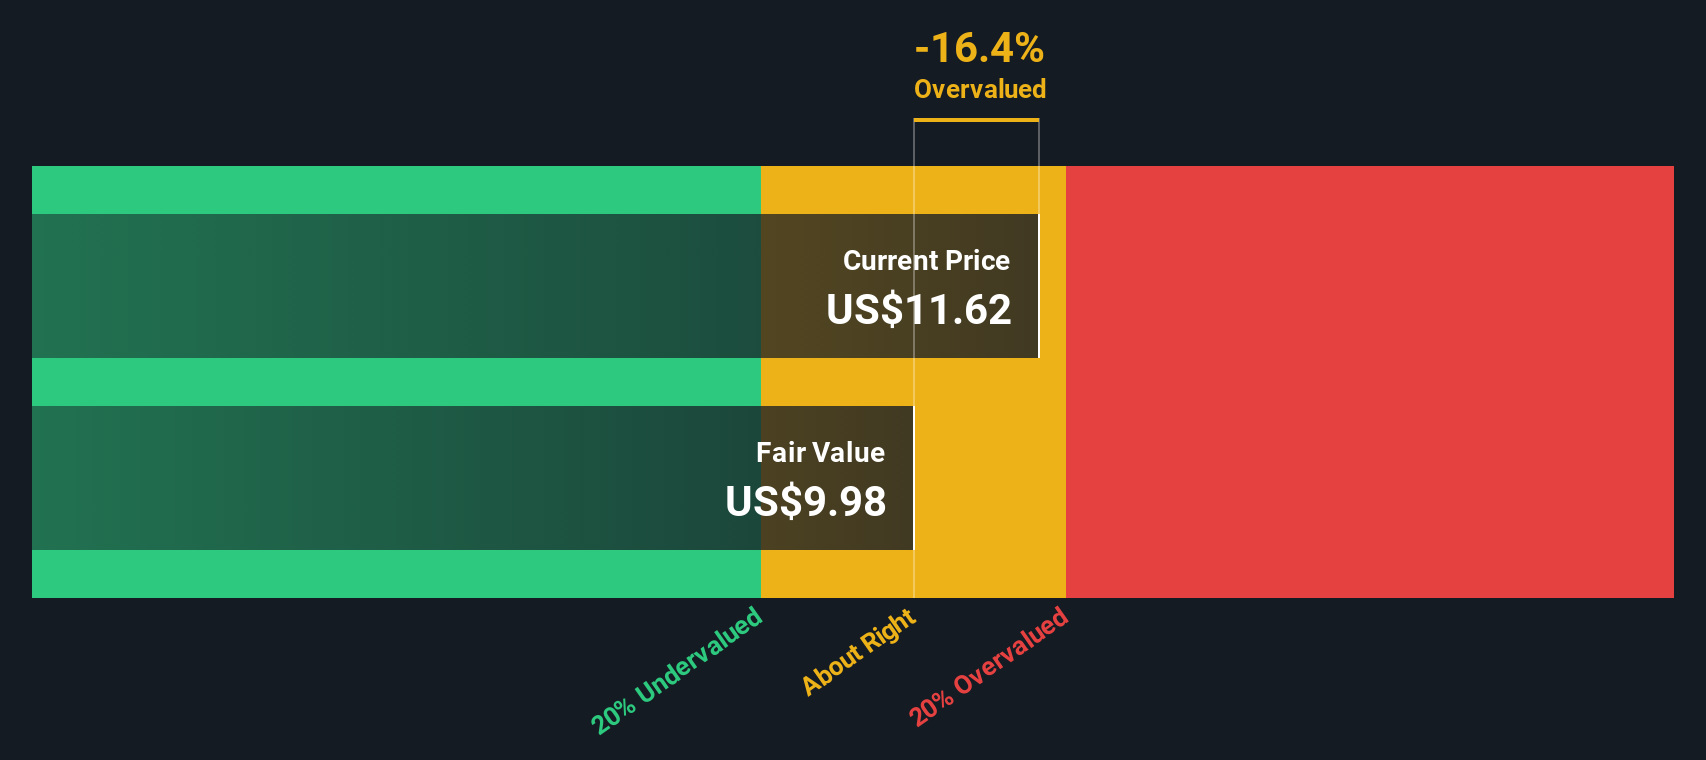
A Discounted Cash Flow model estimates what a company is worth by projecting its future cash flows and then discounting them back to today, to reflect risk and the time value of money.
For Ford Motor, the model starts with last twelve month Free Cash Flow of about $11.7 billion. Analysts provide detailed forecasts for the next few years, with Simply Wall St extrapolating beyond that. Based on a 2 Stage Free Cash Flow to Equity approach, Ford's annual Free Cash Flow is projected to be around $4.7 billion by 2035, which implies a generally moderating cash flow profile over time as growth slows.
Combining these cash flow projections, the DCF model arrives at an intrinsic value of roughly $11.69 per share. With the stock trading around $13, this implies Ford is about 11.4% overvalued on a cash flow basis. This suggests the market is already pricing in a fair amount of optimism.
Result: OVERVALUED
Our Discounted Cash Flow (DCF) analysis suggests Ford Motor may be overvalued by 11.4%. Discover 907 undervalued stocks or create your own screener to find better value opportunities.
Approach 2: Ford Motor Price vs Earnings
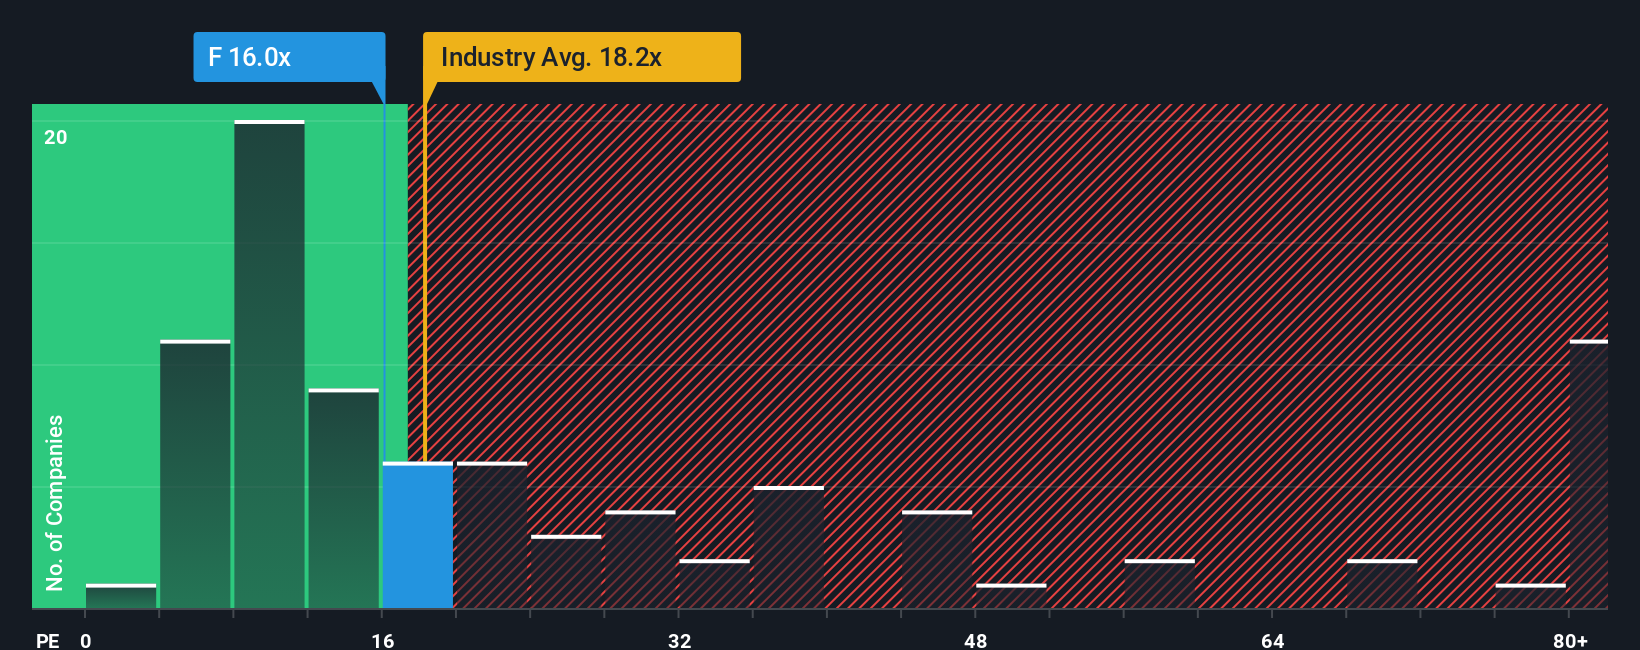
For a mature, profitable business like Ford, the price to earnings ratio is a practical way to gauge whether investors are paying a reasonable price for each dollar of earnings. In general, faster growth and lower risk justify a higher PE, while slower growth or higher uncertainty call for a lower, more cautious multiple.
Ford currently trades on a PE of about 11.0x, which is well below both the Auto industry average of roughly 18.6x and the broader peer group average near 25.7x. On those simple comparisons alone, the stock looks inexpensive. However, peers can have very different growth profiles, profitability and balance sheet strength, so headline comparisons only tell part of the story.
Simply Wall St approaches this with a proprietary Fair Ratio, which estimates the PE Ford could trade on given its earnings growth outlook, industry, profit margins, market cap and specific risks. For Ford, that Fair Ratio is around 19.4x, materially higher than its current 11.0x multiple. Because this framework adjusts for the factors that make Ford different from its peers, it provides a more tailored benchmark and indicates that the market may still be pricing Ford at a meaningful discount.
Result: UNDERVALUED
PE ratios tell one story, but what if the real opportunity lies elsewhere? Discover 1452 companies where insiders are betting big on explosive growth.
Upgrade Your Decision Making: Choose your Ford Motor Narrative
Earlier we mentioned that there is an even better way to understand valuation, so let us introduce you to Narratives, a simple way to connect your view of Ford Motor's future to a concrete forecast and fair value, and then compare that to today's price. A Narrative is your story behind the numbers, where you spell out what you think will happen to Ford's revenue, margins and earnings, and let the Simply Wall St platform, via the Community page used by millions of investors, translate that into a living financial model and a Fair Value estimate that updates automatically when new information like news or earnings lands. Narratives can help make decisions more intuitive, because you can see at a glance whether your Fair Value is above or below the current share price and by how much. For example, one Ford Narrative might lean bullish, assuming EV losses narrow quickly and digital services scale, and arrive at a Fair Value well above the latest $16.0 analyst target. In contrast, a more cautious Narrative might focus on aluminum supply disruptions and slower EV adoption, yielding a Fair Value closer to the most bearish $8.0 target.
Do you think there's more to the story for Ford Motor? Head over to our Community to see what others are saying!

This article by Simply Wall St is general in nature. We provide commentary based on historical data and analyst forecasts only using an unbiased methodology and our articles are not intended to be financial advice. It does not constitute a recommendation to buy or sell any stock, and does not take account of your objectives, or your financial situation. We aim to bring you long-term focused analysis driven by fundamental data. Note that our analysis may not factor in the latest price-sensitive company announcements or qualitative material. Simply Wall St has no position in any stocks mentioned.
Have feedback on this article? Concerned about the content? Get in touch with us directly. Alternatively, email editorial-team@simplywallst.com