
- PREMIUM
- LIVE QUOTES
- INSTITUTION
 Index Options
 State Street
 CME Group
 Nasdaq
 Cboe
Cboe TradingView
 Wall Street Journal
Has the Market Fully Priced In Amgen’s Rally After Pipeline and Regulatory Milestones?
- Wondering if Amgen at around $329 a share is still a smart buy, or if the upside has mostly been priced in already? You are not alone, and this article is going to unpack what that current price really implies.
- Despite a choppy week with a -4.5% move over the last 7 days, Amgen is still up 3.0% over the past month and a strong 27.2% year to date, with a 25.0% gain over 1 year and 69.8% over 5 years, a profile that hints at both growth potential and shifting market risk perceptions.
- Recent headlines around Amgen have focused on its expanding pipeline, regulatory milestones, and strategic deals. All of these help explain why investors have been willing to re rate the stock in recent months. From new late stage assets to ongoing collaborations, the narrative in the news flow has increasingly framed Amgen as a more diversified and durable cash generator rather than just a mature biotech name.
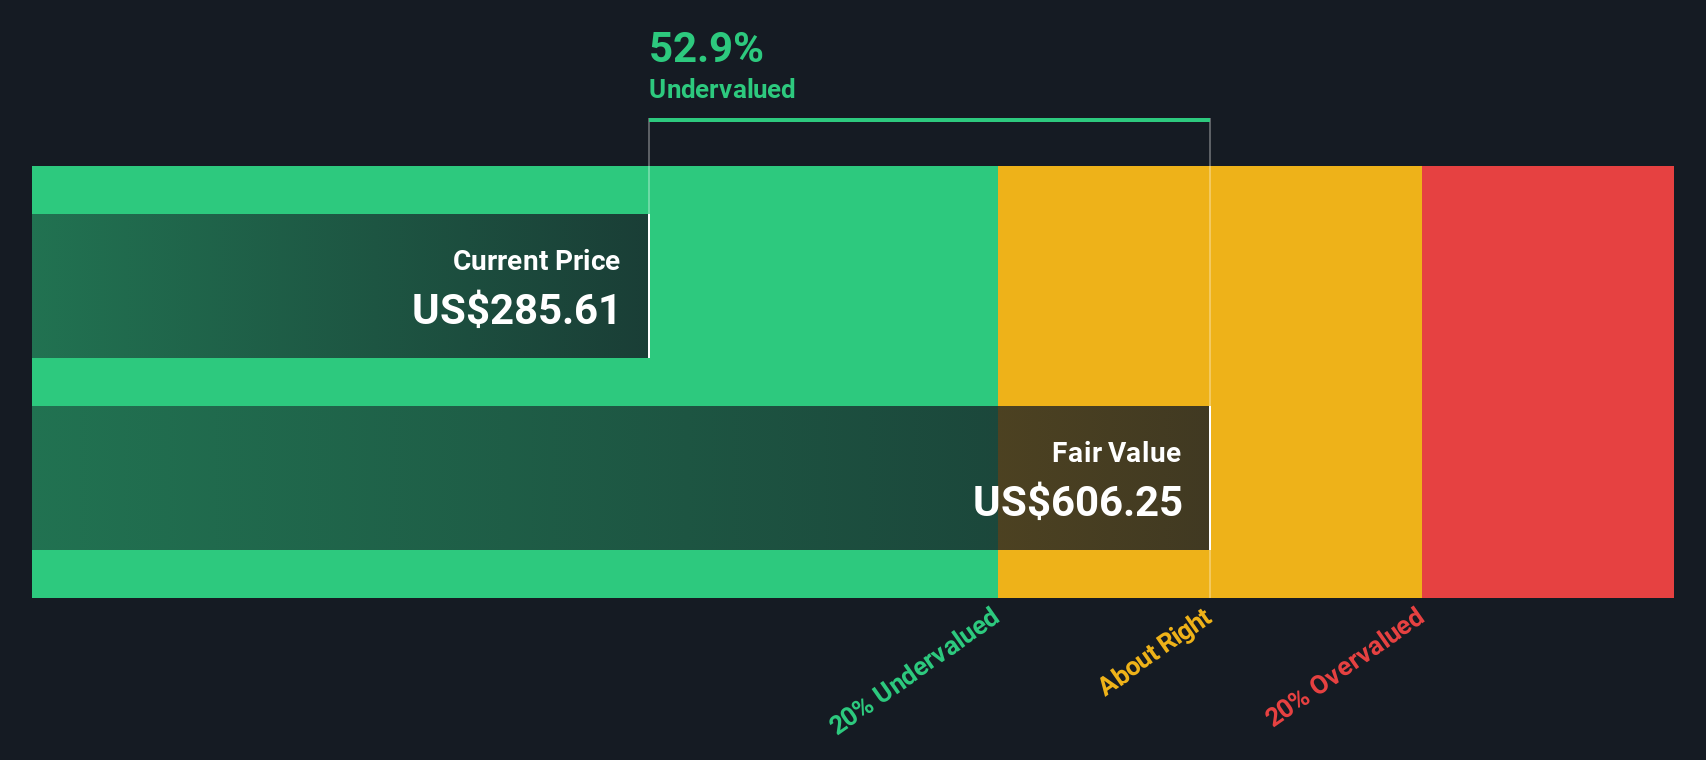
- On our valuation framework, Amgen scores a 4/6, meaning it screens as undervalued on four of six key checks. In this article we will walk through what different valuation methods say about that price tag and, by the end, explore an even better way to think about what Amgen is really worth.
Approach 1: Amgen Discounted Cash Flow (DCF) Analysis
A Discounted Cash Flow model takes Amgen’s future cash flow projections and discounts them back to today, aiming to estimate what the entire business is worth in $ right now.
Amgen generated about $11.7 billion in Free Cash Flow over the last twelve months, a strong starting base for valuation. Analysts project Free Cash Flow to rise into the mid teens over the coming years, with Simply Wall St extrapolating this out to around $17.0 billion by 2035 as growth gradually slows. These forecasts, combined with an appropriate discount rate and a 2 stage Free Cash Flow to Equity approach, are used to convert that stream of future $ cash flows into a single present value figure.
On this basis, the DCF model estimates Amgen’s intrinsic value at roughly $554 per share. This implies the current price around $329 reflects a 40.5% discount to fair value. In other words, the cash flow outlook suggests the market is not fully pricing in Amgen’s long term earning power.
Result: UNDERVALUED
Our Discounted Cash Flow (DCF) analysis suggests Amgen is undervalued by 40.5%. Track this in your watchlist or portfolio, or discover 907 more undervalued stocks based on cash flows.
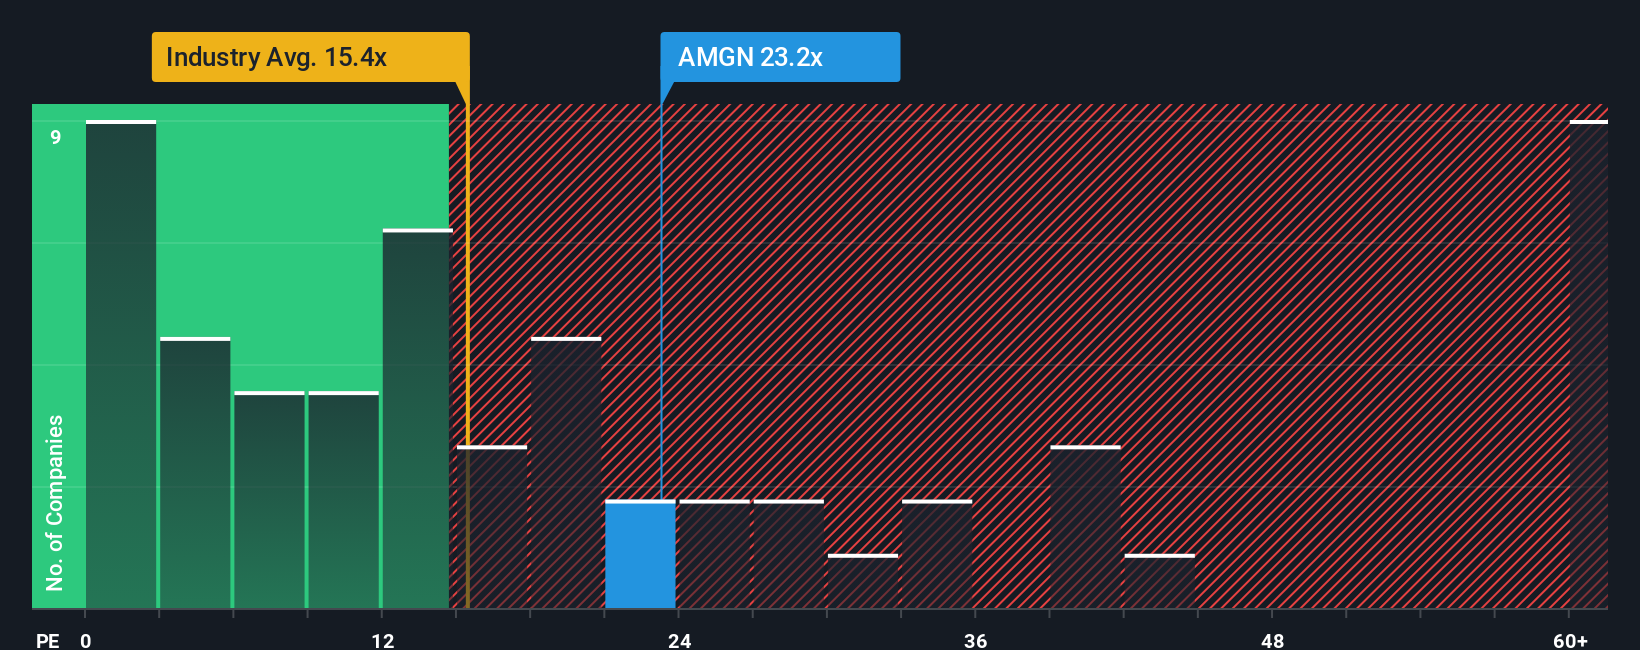
Approach 2: Amgen Price vs Earnings
For a profitable, established business like Amgen, the price to earnings, or PE, ratio is a useful way to gauge how much investors are willing to pay for each dollar of current earnings. Higher growth and lower perceived risk usually justify a higher PE, while slower growth or elevated uncertainty should push a fair multiple lower.
Amgen currently trades on a PE of about 25.4x. That is above the broader Biotechs industry average of roughly 19.1x, but well below the 59.1x average of its peer group, which includes some faster growing and more speculative names. To move beyond simple comparisons, Simply Wall St uses a Fair Ratio (here 29.4x) which estimates the PE Amgen should trade on once its growth prospects, profitability, industry, market cap and risk profile are all taken into account.
Because this Fair Ratio is meaningfully higher than Amgen’s current PE, the model suggests the market is still applying a discount to the company’s fundamentals rather than overpaying for its earnings power.
Result: UNDERVALUED
PE ratios tell one story, but what if the real opportunity lies elsewhere? Discover 1452 companies where insiders are betting big on explosive growth.
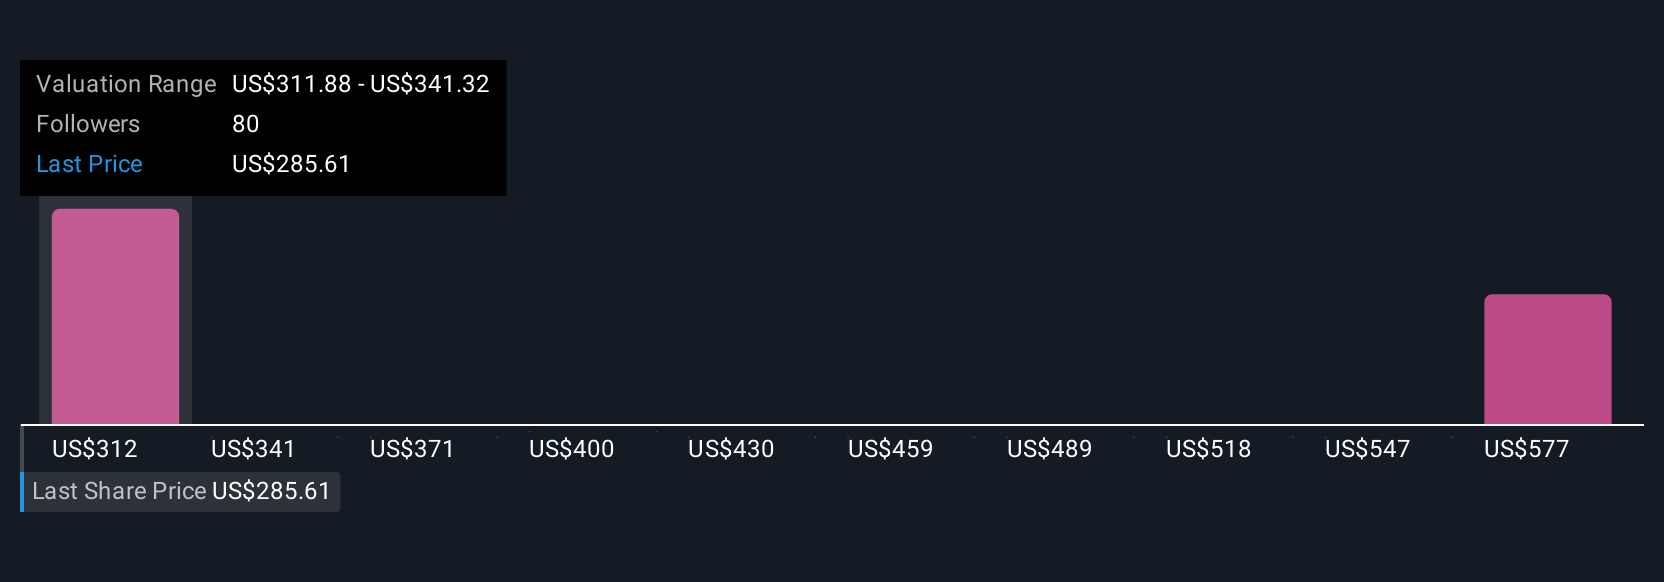
Upgrade Your Decision Making: Choose your Amgen Narrative
Earlier we mentioned that there is an even better way to understand valuation, so let us introduce you to Narratives, a simple way to connect your view of Amgen’s story with a concrete forecast and Fair Value number. A Narrative is your version of what happens next for the business, tying together what you expect for future revenue, earnings and margins with the price you think is reasonable for the stock. On Simply Wall St, millions of investors build and explore Narratives on the Community page, where each Narrative turns a storyline into specific forecasts and a Fair Value that can be compared directly to today’s share price to decide whether Amgen looks like a buy, hold, or sell. These Narratives update dynamically as new news, earnings, or guidance come in, so your view of Amgen can automatically adjust as reality changes. For example, one Amgen Narrative on the platform might lean bullish with a Fair Value near $405 per share based on stronger growth and margin expansion, while another takes a cautious stance with a Fair Value closer to $219, reflecting weaker growth assumptions and more pressure on profitability.
For Amgen however we will make it really easy for you with previews of two leading Amgen Narratives:
Fair Value: $404.87 per share
Implied Upside vs Current Price: 18.6% undervalued
Revenue Growth Assumption: 7.06% per year
- Assumes double digit volume expansion across more than a dozen products, with AI driven R&D and a broad late stage pipeline turning Amgen into a faster growing, higher margin biotech.
- Expects resilient pricing, strong free cash flow and ample capacity for bolt on M&A to extend leadership in obesity, oncology, inflammation and rare diseases.
- Sees risks from policy shifts, biosimilar competition, R&D execution and large acquisitions, but judges the upside in earnings power and scale to more than offset them at today’s price.
Fair Value: $322.88 per share
Implied Downside vs Current Price: 2.2% overvalued
Revenue Growth Assumption: 2.05% per year
- Projects modest low single digit revenue growth and only gradual margin expansion, with valuation already reflecting much of the near term pipeline and biosimilar opportunity.
- Highlights mounting drug pricing pressure, biosimilar competition, heavy R&D and capex needs, and regulatory uncertainty as structural headwinds to sustained earnings acceleration.
- Warns that demographic saturation in key developed markets and intense competition, especially in obesity and cardiovascular care, could cap Amgen’s long run growth and justify only a limited premium to peers.
Do you think there's more to the story for Amgen? Head over to our Community to see what others are saying!
This article by Simply Wall St is general in nature. We provide commentary based on historical data and analyst forecasts only using an unbiased methodology and our articles are not intended to be financial advice. It does not constitute a recommendation to buy or sell any stock, and does not take account of your objectives, or your financial situation. We aim to bring you long-term focused analysis driven by fundamental data. Note that our analysis may not factor in the latest price-sensitive company announcements or qualitative material. Simply Wall St has no position in any stocks mentioned.
Have feedback on this article? Concerned about the content? Get in touch with us directly. Alternatively, email editorial-team@simplywallst.com