
- PREMIUM
- LIVE QUOTES
- INSTITUTION
 Index Options
 State Street
 CME Group
 Nasdaq
 Cboe
Cboe TradingView
 Wall Street Journal
Has Fluence Energy’s 41.7% 2025 Rally Outrun Its Fundamentals?
- If you are wondering whether Fluence Energy is still a smart buy after its recent rally, you are not alone. This stock has quickly moved from a niche energy-storage play to a name that growth focused investors are debating on valuation grounds.
- Over the last week the share price has jumped 22.0%, adding to a 15.2% gain over the past month and a 41.7% rise year to date. The stock is now sitting around $23.96 and is up 41.6% over the past year, roughly 50.7% higher than three years ago.
- Part of this momentum reflects growing optimism around grid scale energy storage, with Fluence regularly highlighted in industry discussions about modernizing power infrastructure and supporting renewable integration. The company has also been in the news for expanding its global project pipeline and software offerings, which helps explain why sentiment has shifted toward viewing it as a key beneficiary of long term energy transition spending.
- Even with that backdrop, Fluence Energy only scores a 3/6 valuation check score, suggesting pockets of undervaluation but also areas where the market might be ahead of itself. In the next sections we will unpack what different valuation methods say about the stock and then finish with a more holistic way to judge whether the current price really makes sense.
Approach 1: Fluence Energy Discounted Cash Flow (DCF) Analysis
A Discounted Cash Flow model estimates what a company is worth today by projecting its future cash flows and then discounting those back into today's dollars. For Fluence Energy, this 2 stage Free Cash Flow to Equity model starts with the latest twelve month free cash flow of about $165 million in the red, highlighting that the business is still burning cash as it scales.
Analysts expect this to improve significantly, with projections moving into positive territory over the next few years and reaching around $188 million of free cash flow by 2030. Beyond the explicit analyst forecasts, Simply Wall St extrapolates additional cash flow growth out to 2035 to capture the longer term potential of Fluence's energy storage platform.
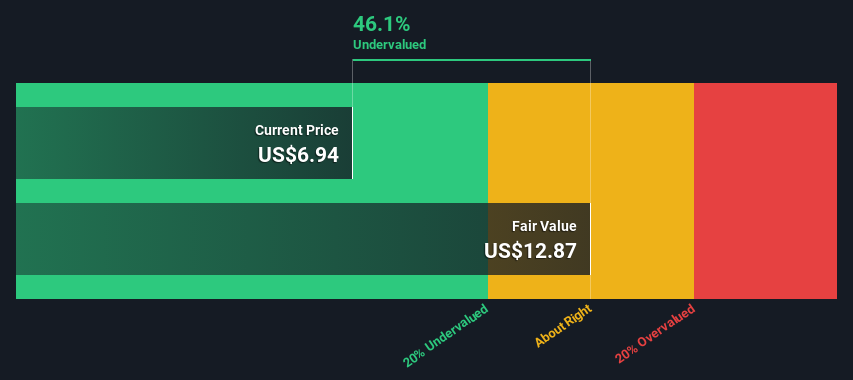
When all these future cash flows are discounted back, the model arrives at an intrinsic value of roughly $17.09 per share, compared with the current share price near $23.96. That implies the stock is about 40.2% above the DCF based estimate of fair value, which indicates that a lot of optimism is already priced in.
Result: OVERVALUED
Our Discounted Cash Flow (DCF) analysis suggests Fluence Energy may be overvalued by 40.2%. Discover 907 undervalued stocks or create your own screener to find better value opportunities.
Approach 2: Fluence Energy Price vs Sales
For companies like Fluence that are still moving toward consistent profitability, the price to sales, or P S, ratio is often a more reliable yardstick than earnings based metrics. It focuses on how much investors are paying for each dollar of revenue, which is less volatile than earnings during heavy investment phases.
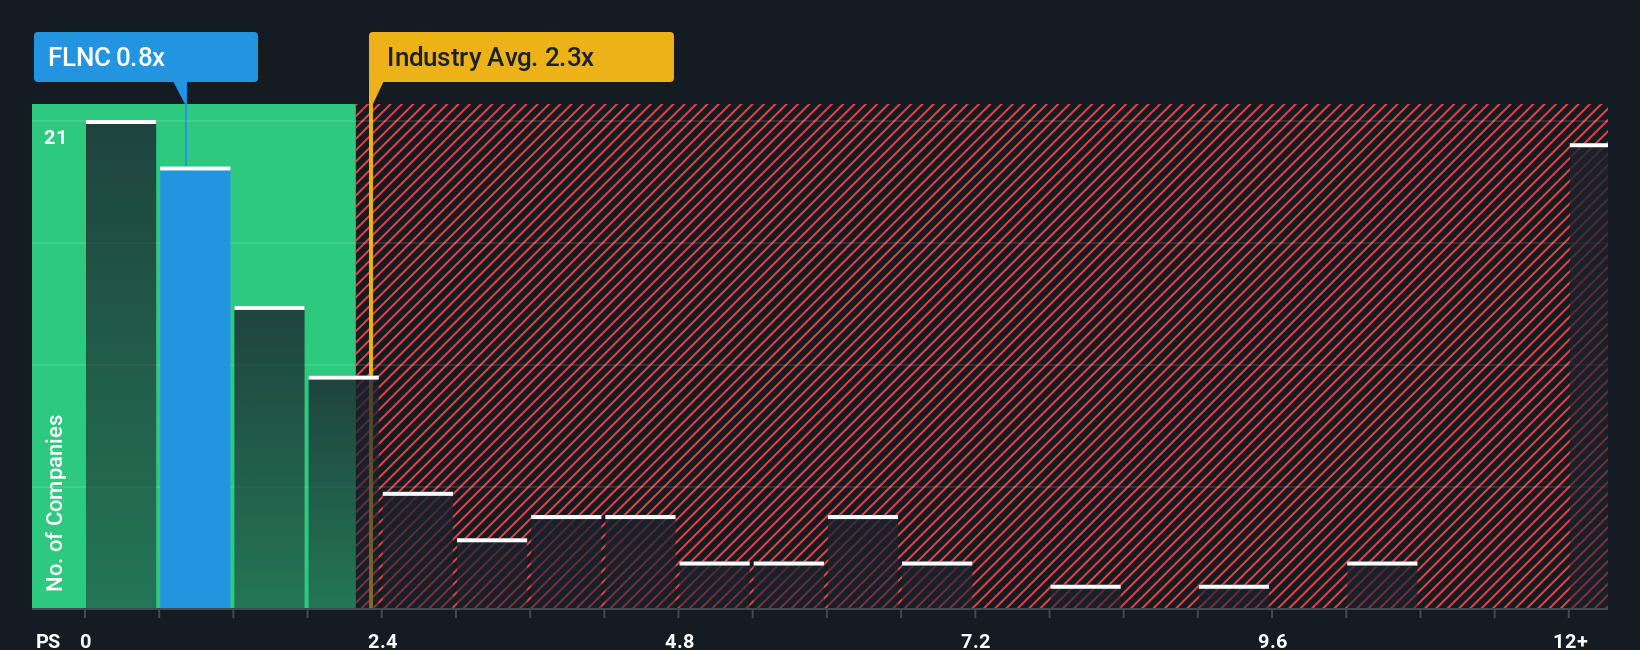
In general, faster growth and lower perceived risk justify a higher P S multiple, while slower growth or higher uncertainty point to a lower, more conservative ratio. Fluence currently trades on a P S of about 1.39x, notably below the Electrical industry average of roughly 2.19x and well under the peer group average of around 4.16x.
Simply Wall St goes a step further with its proprietary Fair Ratio, which estimates what P S multiple Fluence should trade on given its growth profile, margins, industry, market cap and risk factors. For Fluence, this Fair Ratio is 2.16x, indicating the stock is trading on a lower multiple than this framework assigns. Because this approach adjusts for company specific characteristics rather than relying on broad peer or industry comparisons, it offers a more tailored view of value, and on that basis Fluence screens as undervalued within this methodology.
Result: UNDERVALUED
PS ratios tell one story, but what if the real opportunity lies elsewhere? Discover 1452 companies where insiders are betting big on explosive growth.
Upgrade Your Decision Making: Choose your Fluence Energy Narrative
Earlier we mentioned that there is an even better way to understand valuation, so let's introduce you to Narratives, which are simply your story about a company translated into numbers like future revenue, earnings, margins and fair value, then compared to the current share price to help decide whether to buy, hold or sell.
On Simply Wall St's Community page, millions of investors use Narratives as an easy, interactive tool that links what they believe about a business to an explicit financial forecast and a fair value estimate that automatically updates as new news, earnings or guidance come in.
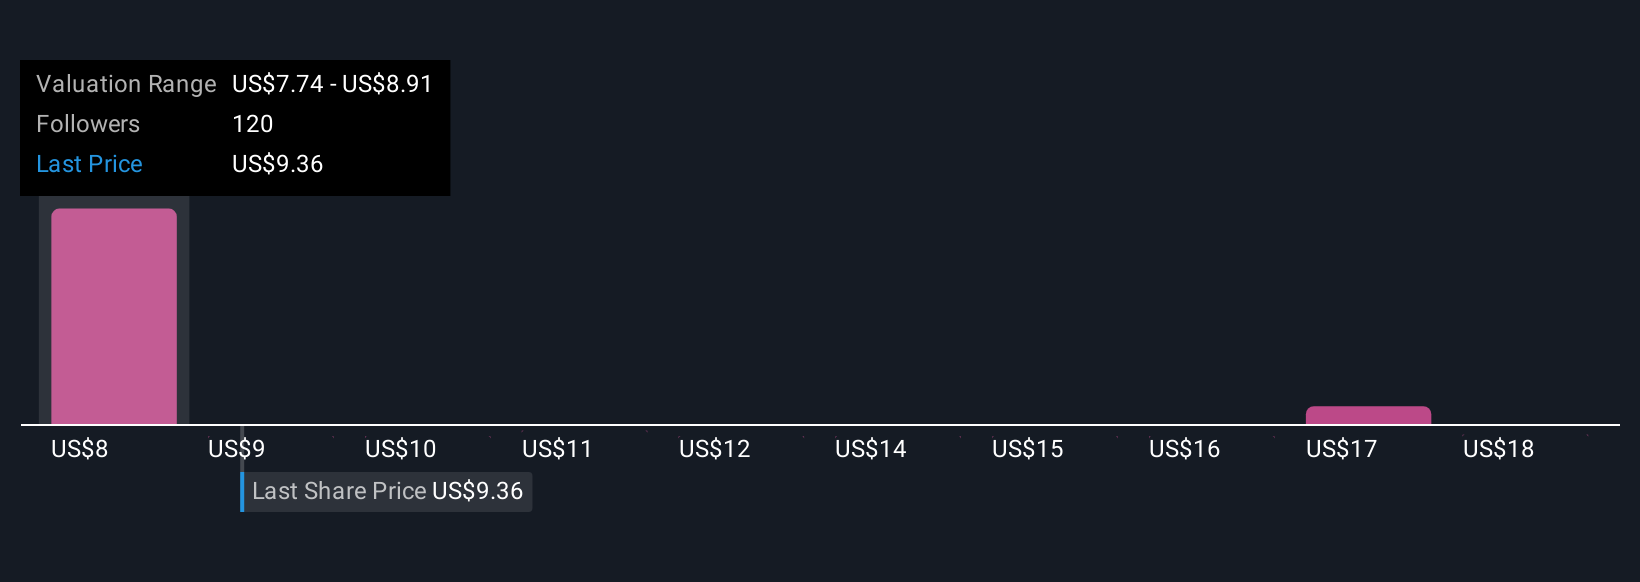
For Fluence Energy, one investor might build a bullish Narrative around rapid storage adoption and margin expansion that supports a fair value near the high end of current community estimates. A more cautious investor could instead plug in slower revenue growth and thinner profitability to arrive at a fair value closer to the low end. Both can then immediately see whether their own Narrative suggests the stock is attractively priced or already expensive today.
Do you think there's more to the story for Fluence Energy? Head over to our Community to see what others are saying!
This article by Simply Wall St is general in nature. We provide commentary based on historical data and analyst forecasts only using an unbiased methodology and our articles are not intended to be financial advice. It does not constitute a recommendation to buy or sell any stock, and does not take account of your objectives, or your financial situation. We aim to bring you long-term focused analysis driven by fundamental data. Note that our analysis may not factor in the latest price-sensitive company announcements or qualitative material. Simply Wall St has no position in any stocks mentioned.
Have feedback on this article? Concerned about the content? Get in touch with us directly. Alternatively, email editorial-team@simplywallst.com