
- PREMIUM
- LIVE QUOTES
- INSTITUTION
 Index Options
 State Street
 CME Group
 Nasdaq
 Cboe
Cboe TradingView
 Wall Street Journal
Has the 21% Slide in Molson Coors Opened a Long Term Opportunity?
- If you are wondering whether Molson Coors Beverage is a value opportunity hiding in plain sight or a stock that is cheap for a reason, you are in the right place.
- The share price has drifted lower, down about 3.0% over the last week, 2.6% over the past month, and a much steeper 21.1% year to date. This naturally raises questions about whether the market is getting overly pessimistic or finally catching up with reality.
- Those moves are playing out against a backdrop of shifting beer demand. Molson Coors is leaning harder into above core brands and non beer adjacencies as traditional volumes face pressure from changing consumer tastes. At the same time, competitive dynamics in North American beer have been evolving as rivals reshuffle their brand strategies, leaving investors to figure out which players stand to gain over the longer term.
- On our numbers, Molson Coors earns a valuation score of 5/6, suggesting the stock screens as undervalued on most of the key checks. Next we will unpack what different valuation approaches say about that verdict and finish by looking at another way to think about its fair value in context.
Find out why Molson Coors Beverage's -23.4% return over the last year is lagging behind its peers.
Approach 1: Molson Coors Beverage Discounted Cash Flow (DCF) Analysis
A Discounted Cash Flow model estimates what a business is worth today by projecting the cash it can generate in the future and then discounting those cash flows back to their value in today’s dollars.
For Molson Coors Beverage, the latest twelve months Free Cash Flow stands at about $1.08 billion. Analysts and internal estimates expect Free Cash Flow to stay around the $1.2 billion to $1.5 billion range over the coming decade, with projected Free Cash Flow of roughly $1.51 billion by 2035 based on Simply Wall St’s two stage Free Cash Flow to Equity model. Early years are driven by analyst forecasts, while later years are extrapolated using more modest growth assumptions.
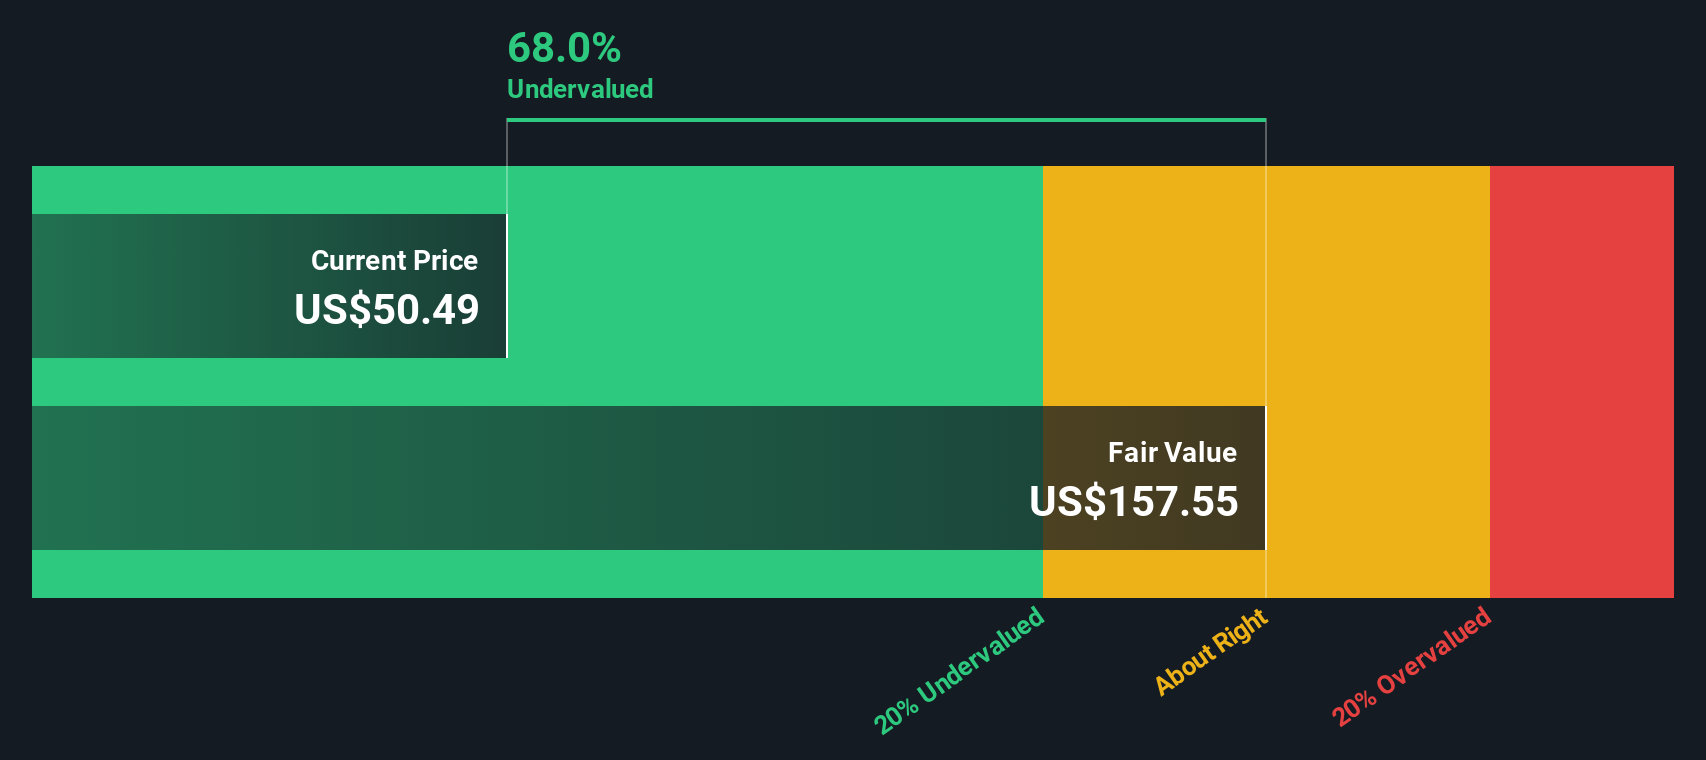
When those projected cash flows are discounted back, the model arrives at an intrinsic value of about $157.08 per share. Compared with the current market price, this implies the stock is trading at roughly a 71.3% discount. This indicates investors are paying substantially less than the estimated value of the underlying cash flows.
Result: UNDERVALUED
Our Discounted Cash Flow (DCF) analysis suggests Molson Coors Beverage is undervalued by 71.3%. Track this in your watchlist or portfolio, or discover 907 more undervalued stocks based on cash flows.
Approach 2: Molson Coors Beverage Price vs Sales
For companies like Molson Coors that are established, generate meaningful revenue, and operate in a relatively mature category, the price to sales ratio is a practical way to judge valuation. Investors are effectively asking how many dollars they are paying for each dollar of annual sales, and that tends to be more stable than earnings for businesses where margins can swing with input costs and marketing spend.
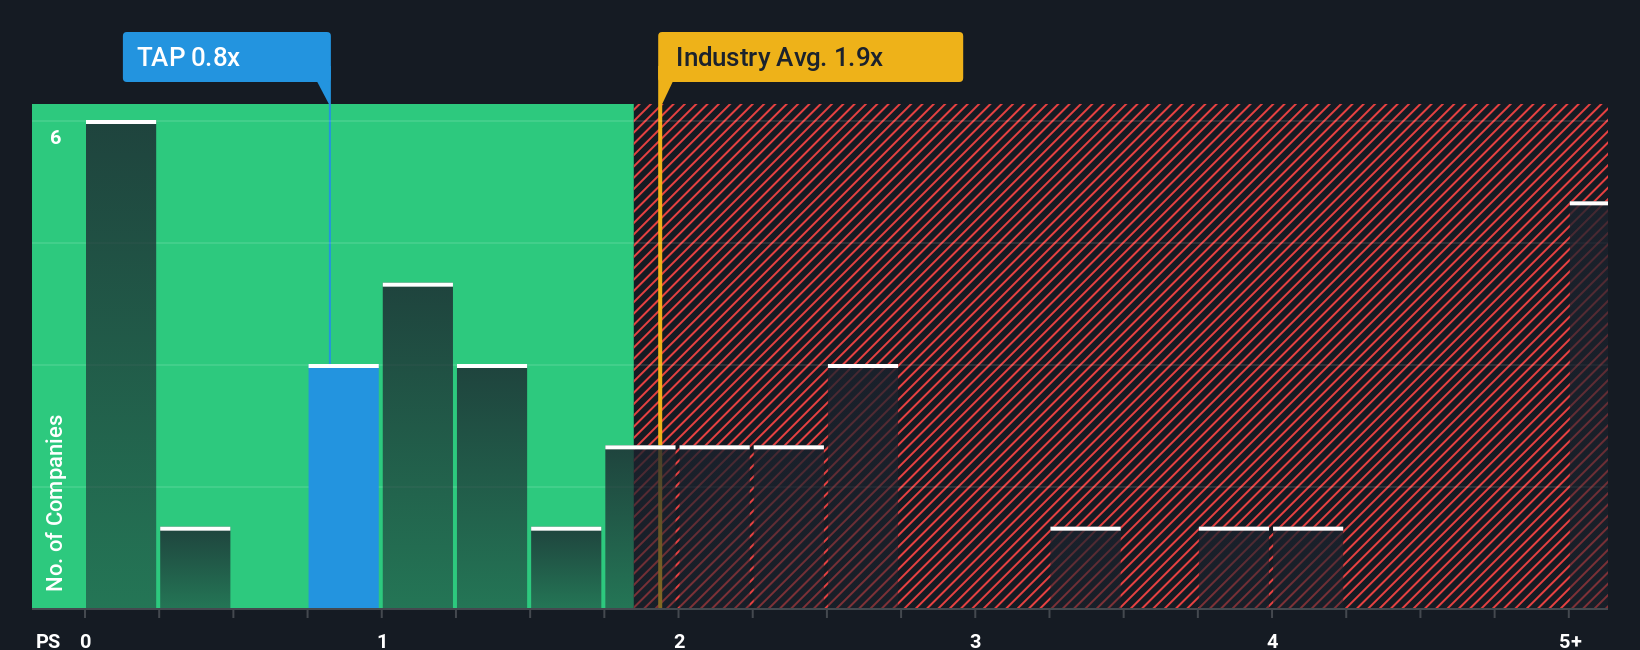
In general, faster growing and less risky beverage companies justify higher price to sales multiples, while slower growing or more volatile names should trade on lower ratios. Molson Coors currently trades on a price to sales multiple of about 0.80x, which is well below both the Beverage industry average of around 2.29x and a peer group average of roughly 1.90x.
Simply Wall St’s Fair Ratio framework estimates what price to sales multiple would be reasonable for Molson Coors given its specific mix of growth prospects, risk profile, profitability, size, and industry positioning. This tends to be more informative than simple peer or industry comparisons, which ignore those nuances. On that basis, Molson Coors’ Fair Ratio is 1.28x, noticeably above the current 0.80x, which suggests the shares are trading below what its fundamentals would typically warrant.
Result: UNDERVALUED
PS ratios tell one story, but what if the real opportunity lies elsewhere? Discover 1452 companies where insiders are betting big on explosive growth.
Upgrade Your Decision Making: Choose your Molson Coors Beverage Narrative
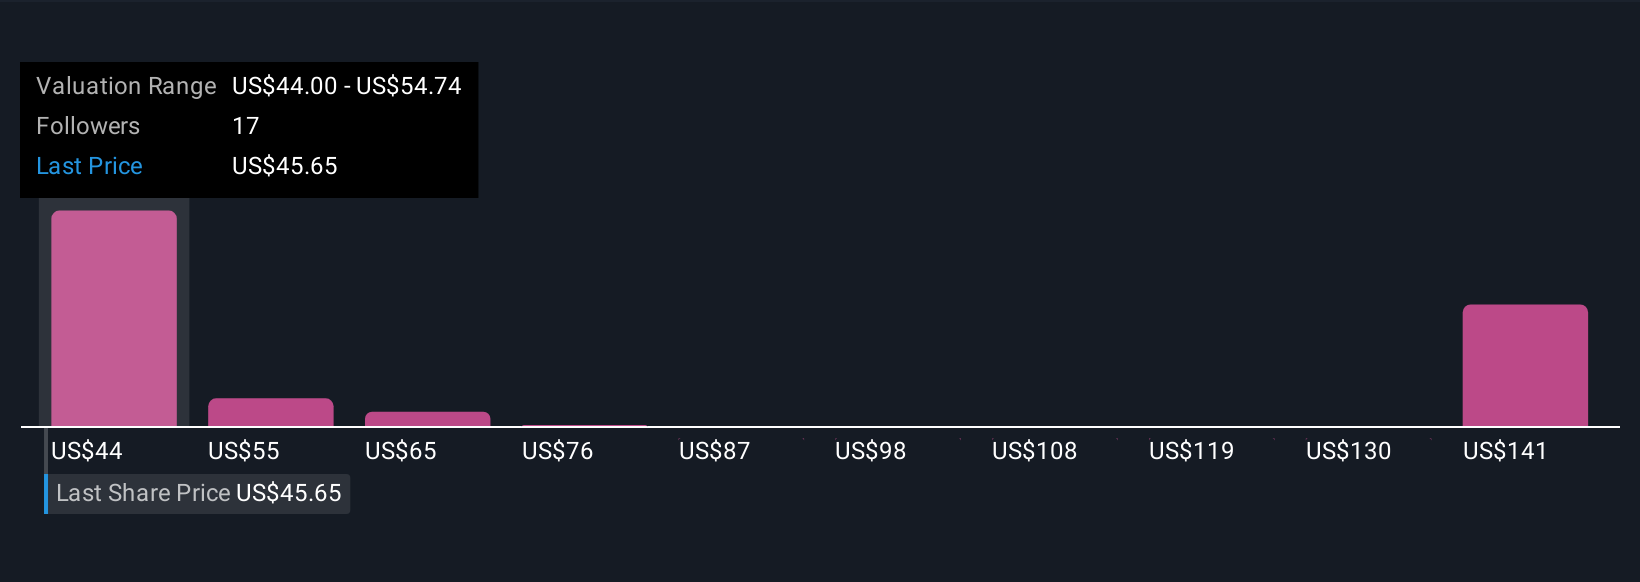
Earlier we mentioned that there is an even better way to understand valuation, so let us introduce you to Narratives, a simple way to connect your view of a company’s story with a structured forecast and a clear fair value, all within the Simply Wall St Community page used by millions of investors. A Narrative lets you spell out what you think will happen to Molson Coors Beverage’s revenue, earnings, and margins, turns that into a financial forecast, and then compares the resulting Fair Value to today’s share price so you can see whether your story says buy, hold, or sell, with the numbers updating dynamically as fresh news or earnings land. For Molson Coors, one investor might build a bullish Narrative that leans on premiumization, international growth, and margin expansion to outline a value closer to $72 per share. Another might focus on volume decline, category softness, and competitive pressure to anchor a more cautious story nearer $42. Both perspectives can coexist, evolve, and be directly compared as new information becomes available.
Do you think there's more to the story for Molson Coors Beverage? Head over to our Community to see what others are saying!
This article by Simply Wall St is general in nature. We provide commentary based on historical data and analyst forecasts only using an unbiased methodology and our articles are not intended to be financial advice. It does not constitute a recommendation to buy or sell any stock, and does not take account of your objectives, or your financial situation. We aim to bring you long-term focused analysis driven by fundamental data. Note that our analysis may not factor in the latest price-sensitive company announcements or qualitative material. Simply Wall St has no position in any stocks mentioned.
Have feedback on this article? Concerned about the content? Get in touch with us directly. Alternatively, email editorial-team@simplywallst.com