
- PREMIUM
- LIVE QUOTES
- INSTITUTION
 Index Options
 State Street
 CME Group
 Nasdaq
 Cboe
Cboe TradingView
 Wall Street Journal
Stellantis (BIT:STLAM) Valuation Check as New Dodge Charger Lineup Redefines Modern Muscle Cars
Stellantis (BIT:STLAM) just flipped the switch on its next generation Dodge Charger lineup, building high horsepower SIXPACK gasoline models alongside the all electric Daytona Scat Pack, a mix that matters for both margins and narrative.
See our latest analysis for Stellantis.
The new Charger lineup helps explain why Stellantis has enjoyed a 36.63% 3 month share price return even as its year to date share price return remains negative. This suggests sentiment is recovering, but longer term total shareholder returns are still catching up.
If this kind of muscle car rethink has you looking wider in autos, it is worth exploring other auto manufacturers that might be revving up their own comeback stories.
With shares still down over the year but trading at a steep discount to intrinsic value even after a sharp 3 month rally, is Stellantis a mispriced turnaround engine, or are markets already discounting the next leg of growth?
Most Popular Narrative Narrative: 7.8% Overvalued
With Stellantis closing at €10.41 against a narrative fair value of about €9.66, the story implies expectations are now running slightly ahead of fundamentals.
Sequential improvements in operating margins and halved cash flow outflows from 2H 2024 to 1H 2025, combined with a robust liquidity position (25-30% of trailing 12-month revenue), indicate underlying operational progress that could drive higher future net margins and cash generation as near-term headwinds subside.
Curious how modest revenue growth, rising margins, and a low future earnings multiple can still justify a higher long term value than today’s price? The key assumptions might surprise you.
Result: Fair Value of $9.66 (OVERVALUED)
Have a read of the narrative in full and understand what's behind the forecasts.
However, lingering tariff uncertainty and pressure on European margins from less profitable EVs could quickly undermine the improving earnings and valuation narrative.
Find out about the key risks to this Stellantis narrative.
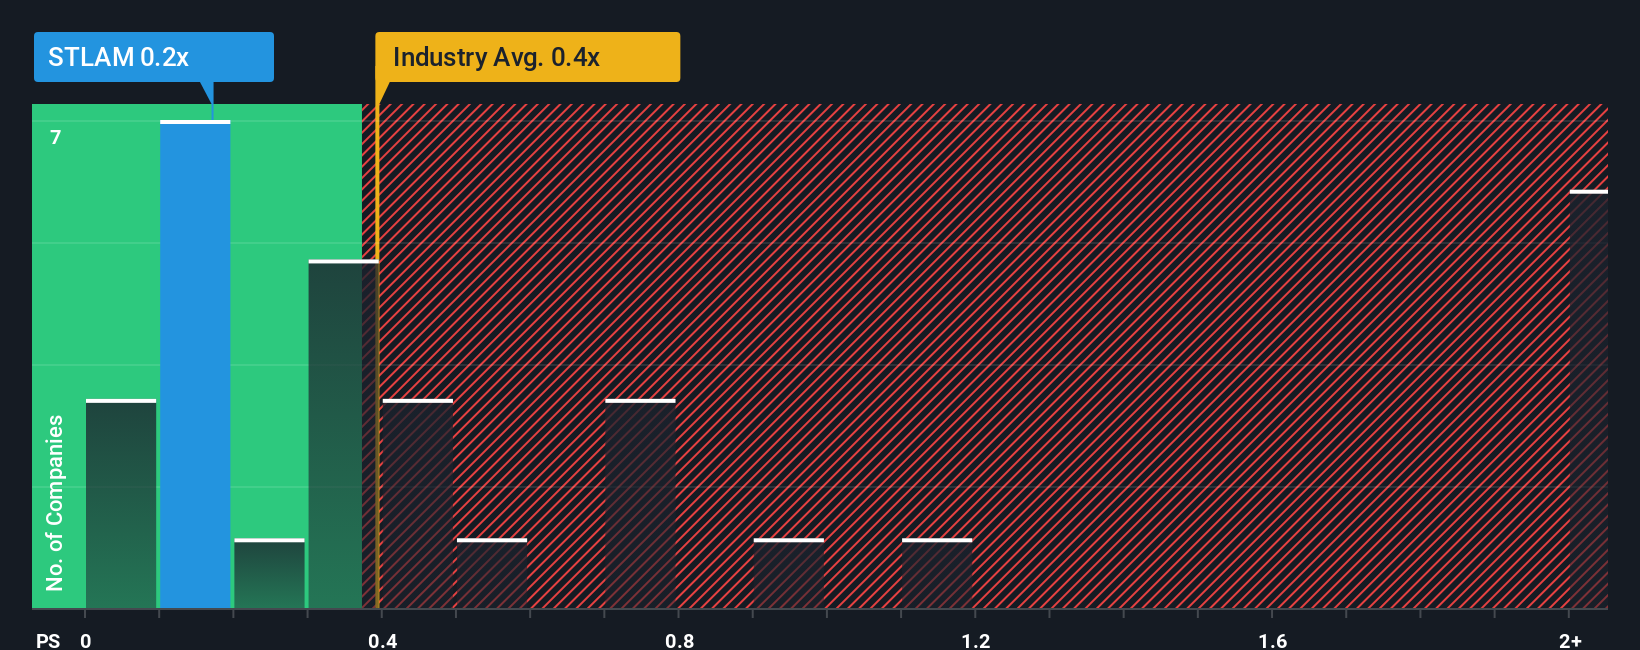
Another View: Market Ratios Tell a Different Story
While the narrative model flags Stellantis as modestly overvalued, its price to sales ratio of 0.2 times versus a 0.4 times industry average and a fair ratio of 0.4 times suggests the market may be underpricing its revenue base, creating more upside than downside if sentiment returns to typical levels.
See what the numbers say about this price — find out in our valuation breakdown.
Build Your Own Stellantis Narrative
If you see the story differently or simply want to dig into the numbers yourself, you can build a custom view in under three minutes: Do it your way.
A great starting point for your Stellantis research is our analysis highlighting 3 key rewards and 2 important warning signs that could impact your investment decision.
Ready for your next investing edge?
If you stop with Stellantis, you could miss the next major winner. Let the Simply Wall Street Screener surface fresh, data driven opportunities before everyone else.
- Turn small positions into potential standouts by targeting these 3574 penny stocks with strong financials with stronger balance sheets and earnings quality than the typical speculative name.
- Ride structural shifts in automation and machine learning by screening for these 26 AI penny stocks positioned to benefit from changes in demand.
- Focus on a growing cash stream today by zeroing in on these 15 dividend stocks with yields > 3% that can support income and total return through different market cycles.
This article by Simply Wall St is general in nature. We provide commentary based on historical data and analyst forecasts only using an unbiased methodology and our articles are not intended to be financial advice. It does not constitute a recommendation to buy or sell any stock, and does not take account of your objectives, or your financial situation. We aim to bring you long-term focused analysis driven by fundamental data. Note that our analysis may not factor in the latest price-sensitive company announcements or qualitative material. Simply Wall St has no position in any stocks mentioned.
Have feedback on this article? Concerned about the content? Get in touch with us directly. Alternatively, email editorial-team@simplywallst.com