
- PREMIUM
- LIVE QUOTES
- INSTITUTION
 Index Options
 State Street
 CME Group
 Nasdaq
 Cboe
Cboe TradingView
 Wall Street Journal
Has Berkshire Hathaway’s 122.8% Five Year Surge Fully Reflected Its Fundamental Strength?
- If you are wondering whether Berkshire Hathaway is still a smart buy at over $500 a share, or if most of the upside has already been priced in, you are not alone.
- The stock has climbed 11.8% year to date and 122.8% over 5 years, even though it has cooled slightly in the last week with a 1.8% pullback and only a modest 1.1% gain over the past month.
- Recent moves have been shaped by ongoing headlines around Berkshire's massive cash pile and how Warren Buffett may deploy it, from buybacks to opportunistic acquisitions. Investors are also reacting to commentary about the health of key holdings such as Apple and major US financials, which together help explain why the share price has been firm but not euphoric.
- Right now, Berkshire scores a 4/6 valuation check. This suggests the market may still be underestimating parts of the business. Below, we will unpack what different valuation methods indicate, before finishing with a more intuitive way to think about what the stock may really be worth.
Approach 1: Berkshire Hathaway Excess Returns Analysis
The Excess Returns model looks at how efficiently Berkshire Hathaway turns its shareholder equity into profits above its required cost of capital, then capitalizes those surplus returns into an intrinsic value per share.
On this basis, Berkshire is starting from a very large equity base, with a Book Value of $485,274.36 per share and a Stable Book Value of $514,986.06 per share, based on forward estimates from two analysts. Using the median return on equity from the past five years, the model derives a Stable EPS of $66,154.88 per share, versus a Cost of Equity of $38,848.82 per share, implying an Excess Return of $27,306.05 per share and an Average Return on Equity of 12.85%.
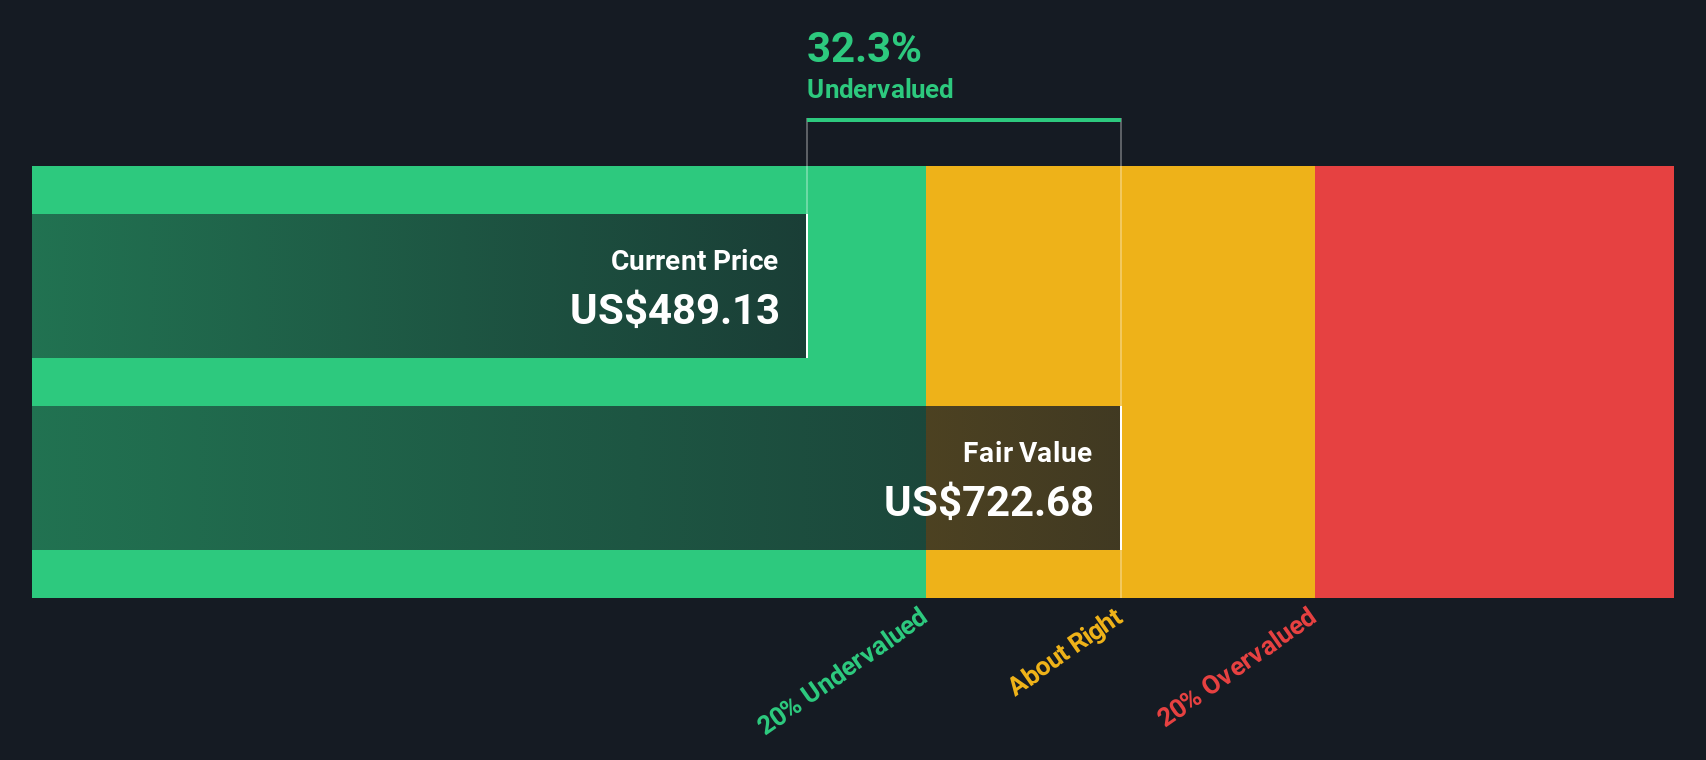
Capitalizing these excess returns produces an intrinsic value estimate of about $769 per share, which implies the stock is roughly 34.4% undervalued relative to its current price.
Result: UNDERVALUED
Our Excess Returns analysis suggests Berkshire Hathaway is undervalued by 34.4%. Track this in your watchlist or portfolio, or discover 907 more undervalued stocks based on cash flows.
Approach 2: Berkshire Hathaway Price vs Earnings
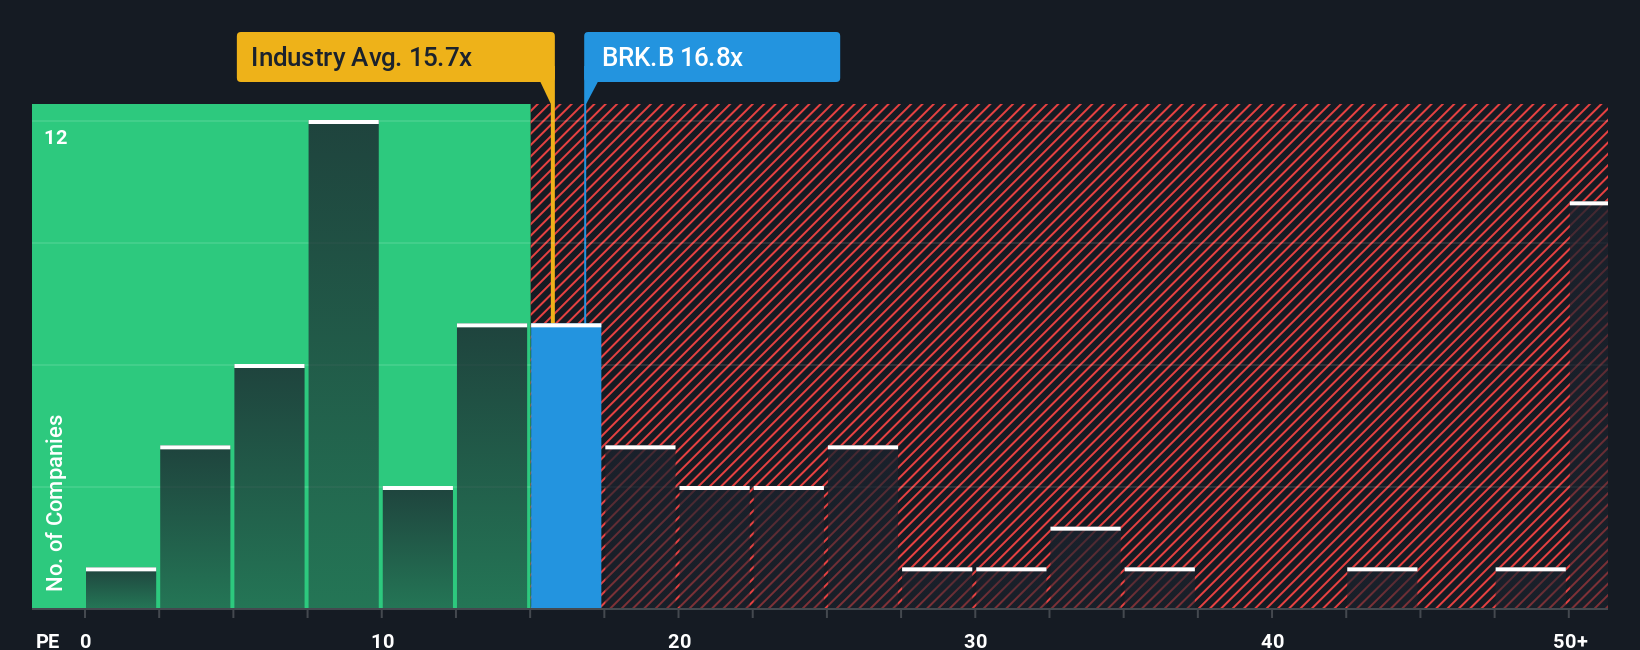
For a profitable, mature business like Berkshire Hathaway, the price to earnings ratio is a useful shorthand for how much investors are willing to pay for each dollar of current profits. It captures not just today’s earnings, but the market’s expectations for future growth and the perceived risk of those earnings continuing.
In general, faster growth and lower risk justify a higher PE, while slower, more volatile earnings growth should command a lower multiple. Berkshire currently trades on a PE of about 16.1x. That is slightly above the Diversified Financial industry average of roughly 13.6x, but well below the wider peer average near 25.3x. This suggests the market is giving Berkshire some credit for quality, but not treating it like a high growth compounder.
Simply Wall St’s Fair Ratio, its proprietary estimate of what a normal PE should be after considering Berkshire’s earnings growth, margins, industry, size and risk profile, sits at around 16.9x. This is more tailored than a simple peer or sector comparison because it adjusts for the company’s specific fundamentals rather than assuming “one size fits all”. Compared with the current PE of 16.1x, this indicates Berkshire is modestly undervalued on earnings.
Result: UNDERVALUED
PE ratios tell one story, but what if the real opportunity lies elsewhere? Discover 1451 companies where insiders are betting big on explosive growth.
Upgrade Your Decision Making: Choose your Berkshire Hathaway Narrative
Earlier we mentioned that there is an even better way to understand valuation, so let us introduce you to Narratives.
A Narrative is simply your story about a company, translated into numbers, where you connect your view of its future with assumptions about revenue growth, profit margins and a fair value estimate.
On Simply Wall St’s Community page, Narratives make this process easy by guiding you from the company’s story to a concrete financial forecast, and finally to a fair value that you can compare with today’s share price to decide whether to buy, hold or sell.
Because Narratives on the platform are updated dynamically when fresh information like earnings reports, news or major macro changes arrive, your valuation can evolve in real time instead of being a one off calculation.
For Berkshire Hathaway, for example, one investor might build a Narrative assuming only modest growth and a conservative valuation, while another might assume stronger compounding, higher long term returns on equity and a materially higher fair value. This shows how the same stock can reasonably support very different, yet transparent, perspectives.
Do you think there's more to the story for Berkshire Hathaway? Head over to our Community to see what others are saying!
This article by Simply Wall St is general in nature. We provide commentary based on historical data and analyst forecasts only using an unbiased methodology and our articles are not intended to be financial advice. It does not constitute a recommendation to buy or sell any stock, and does not take account of your objectives, or your financial situation. We aim to bring you long-term focused analysis driven by fundamental data. Note that our analysis may not factor in the latest price-sensitive company announcements or qualitative material. Simply Wall St has no position in any stocks mentioned.
Have feedback on this article? Concerned about the content? Get in touch with us directly. Alternatively, email editorial-team@simplywallst.com