
- PREMIUM
- LIVE QUOTES
- INSTITUTION
 Index Options
 State Street
 CME Group
 Nasdaq
 Cboe
Cboe TradingView
 Wall Street Journal
Is Steel Dynamics Still Attractive After Its 2025 Rally and Strong Valuation Signals?
- If you are wondering whether Steel Dynamics is still worth buying after its big run, or if the easy money has already been made, you are in the right place to unpack what the market is really pricing in.
- The stock has cooled slightly over the last 7 days with a -1.6% move, but it is still up 7.2% over the last month, 47.6% year to date, 22.6% over 1 year, 59.4% over 3 years, and 359.0% over 5 years.
- Recent momentum in Steel Dynamics has been shaped by ongoing optimism around US infrastructure spending, resilient steel demand, and the company’s continued capital return strategy via buybacks and dividends. Together, these factors have helped support a higher share price as investors reassess both growth prospects and perceived risk.
- Despite that backdrop, Steel Dynamics posts a strong valuation score of 5 out of 6, which may indicate the market is not fully crediting its fundamentals yet. Next, we will break down how different valuation approaches see the stock and then, at the end, explore an additional way to make sense of what Steel Dynamics might really be worth.
Find out why Steel Dynamics's 22.6% return over the last year is lagging behind its peers.
Approach 1: Steel Dynamics Discounted Cash Flow (DCF) Analysis
A Discounted Cash Flow model estimates what a company is worth today by projecting the cash it can generate in the future and discounting those cash flows back to their value in today’s dollars.
For Steel Dynamics, the model starts from last twelve months free cash flow of about $37.3 million and projects it to grow rapidly, reaching around $3.0 billion of free cash flow by 2035 as the business scales. Analyst forecasts cover the next few years, and Simply Wall St extrapolates beyond that to build a 2 Stage Free Cash Flow to Equity model using gradually moderating growth assumptions.
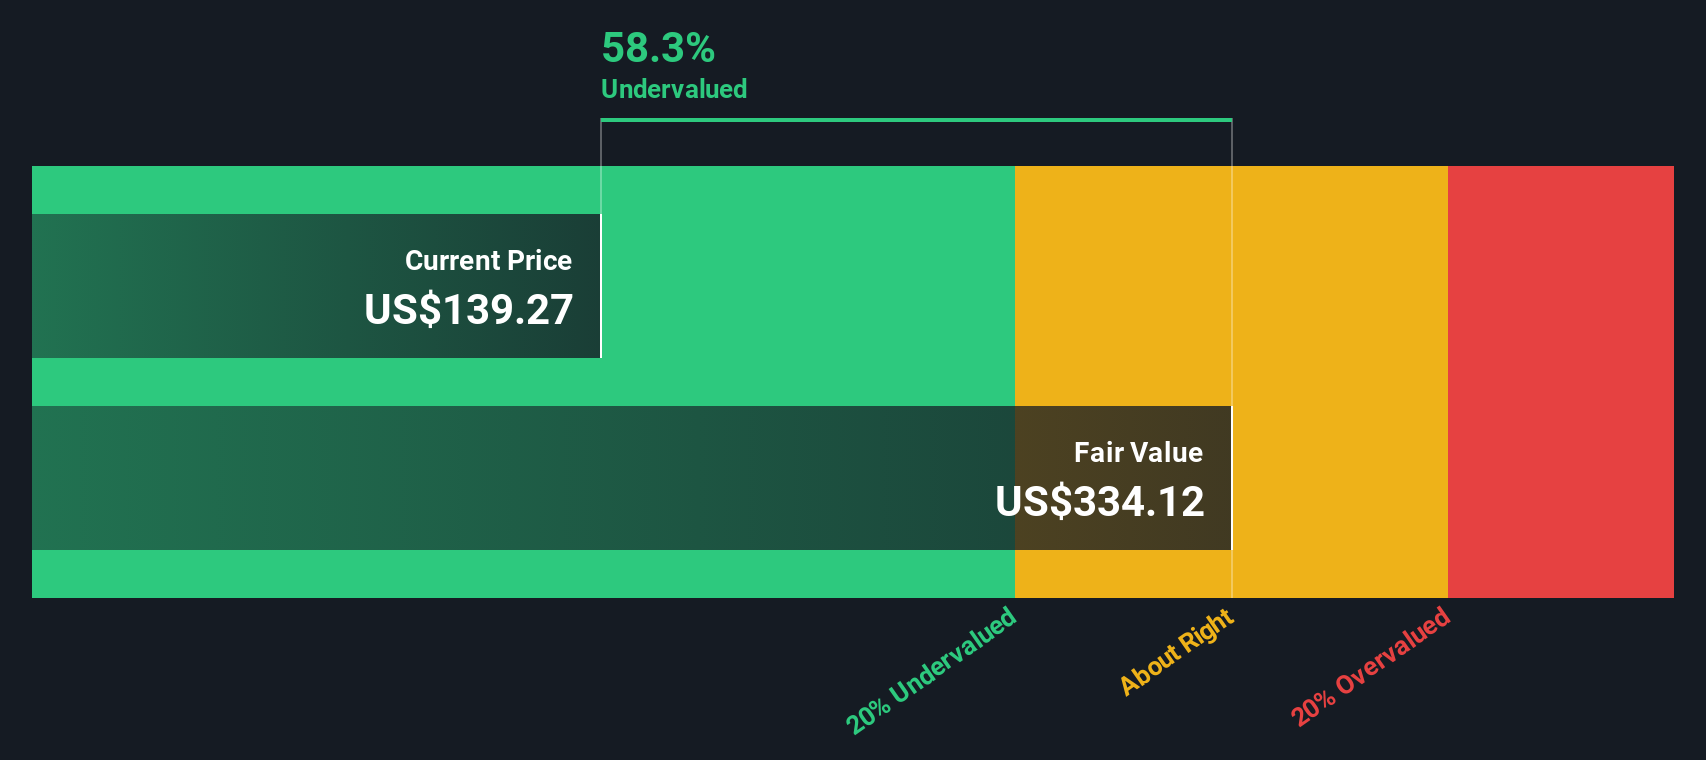
When those future cash flows are discounted back, the DCF model estimates an intrinsic value of roughly $293.23 per share. Compared with the current share price, this implies the stock is about 43.7% undervalued, suggesting the market is still pricing Steel Dynamics conservatively relative to its projected cash generation.
Result: UNDERVALUED
Our Discounted Cash Flow (DCF) analysis suggests Steel Dynamics is undervalued by 43.7%. Track this in your watchlist or portfolio, or discover 909 more undervalued stocks based on cash flows.
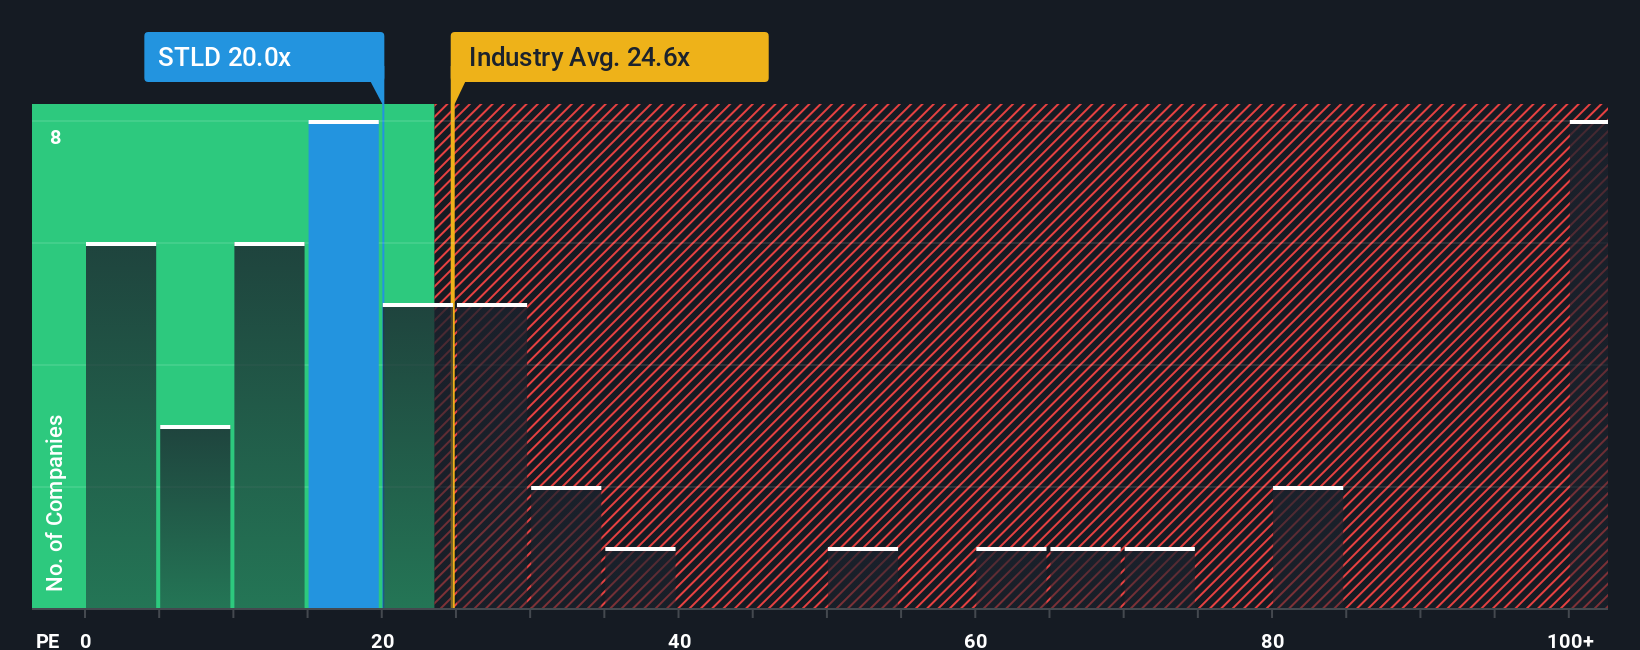
Approach 2: Steel Dynamics Price vs Earnings
For profitable companies like Steel Dynamics, the price to earnings ratio is often the most intuitive valuation yardstick because it ties the share price directly to the bottom line that ultimately supports returns to shareholders.
What counts as a fair PE depends on how fast earnings are expected to grow and how risky those earnings are, with higher growth and lower risk usually justifying a higher multiple and vice versa. Steel Dynamics currently trades on about 21.41x earnings, slightly below the broader Metals and Mining industry average of roughly 22.16x and well below the peer group average of around 35.82x. This suggests the market is not awarding it a premium multiple.
Simply Wall St also applies a Fair Ratio framework, which estimates what PE you would reasonably expect for Steel Dynamics to be about 29.60x, given its specific mix of earnings growth, profit margins, industry positioning, market cap, and risk profile. This approach is more tailored than simple peer or industry comparisons because it adjusts for differences in company quality and outlook rather than assuming one size fits all. With the current PE sitting meaningfully below the 29.60x Fair Ratio, the multiple based view points to Steel Dynamics being undervalued.
Result: UNDERVALUED
PE ratios tell one story, but what if the real opportunity lies elsewhere? Discover 1447 companies where insiders are betting big on explosive growth.
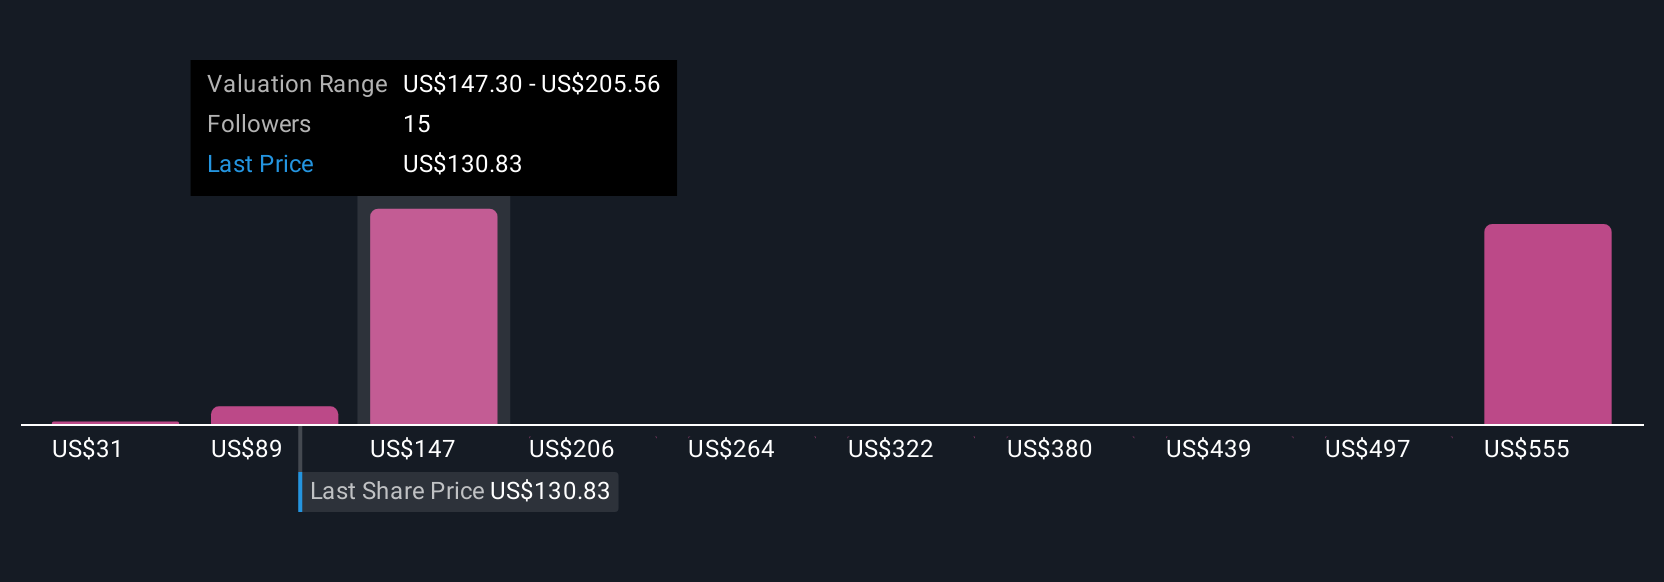
Upgrade Your Decision Making: Choose your Steel Dynamics Narrative
Earlier we mentioned that there is an even better way to understand valuation, so let us introduce you to Narratives, a simple way to turn your view of Steel Dynamics into a story that connects assumptions about future revenue, earnings, and margins to a clear fair value estimate, all within the Community page on Simply Wall St. A Narrative is your own, structured perspective on the company, linking what you believe about demand recovery, tariffs, capital projects, or recycling economics directly to a financial forecast and then to what you think the shares are really worth. This makes it easier to see whether today’s price looks attractive or stretched. Narratives on the platform update dynamically as new news or earnings arrive, so your fair value view stays in sync with fresh information and helps you decide whether to buy, hold, or sell by comparing your Fair Value to the current Price. For example, some Steel Dynamics Narratives on Simply Wall St see fair value well above $160 per share on the back of strong tariff support and margin expansion, while more cautious Narratives sit closer to $130, reflecting worries about global oversupply and slower demand.
Do you think there's more to the story for Steel Dynamics? Head over to our Community to see what others are saying!
This article by Simply Wall St is general in nature. We provide commentary based on historical data and analyst forecasts only using an unbiased methodology and our articles are not intended to be financial advice. It does not constitute a recommendation to buy or sell any stock, and does not take account of your objectives, or your financial situation. We aim to bring you long-term focused analysis driven by fundamental data. Note that our analysis may not factor in the latest price-sensitive company announcements or qualitative material. Simply Wall St has no position in any stocks mentioned.
Have feedback on this article? Concerned about the content? Get in touch with us directly. Alternatively, email editorial-team@simplywallst.com