
- PREMIUM
- LIVE QUOTES
- INSTITUTION
 Index Options
 State Street
 CME Group
 Nasdaq
 Cboe
Cboe TradingView
 Wall Street Journal
Is Everus Construction Group’s 2025 Valuation Justified After Its Strong 32.4% Rally?
- If you are wondering whether Everus Construction Group is still a smart place to put fresh money to work, you are not alone. This stock has quickly become one value hunters are watching closely.
- After climbing an impressive 32.4% year to date and 33.7% over the last year, the share price has cooled slightly in the last month with a 1.6% pullback and is roughly flat over the past week at around $91.75.
- Recent moves have been driven less by headlines grabbing the front page and more by a steady re-rating of construction and infrastructure names as investors look for durable, policy supported growth. Alongside this, sector wide optimism about long dated building and refurbishment pipelines has quietly shifted sentiment on companies like Everus.
- Right now, Everus scores a 3 out of 6 on our valuation checks, suggesting the market may be partly, but not fully, pricing in its strengths. Next we will unpack what that means across different valuation methods, before finishing with a more holistic way to judge whether the current price really makes sense.
Approach 1: Everus Construction Group Discounted Cash Flow (DCF) Analysis
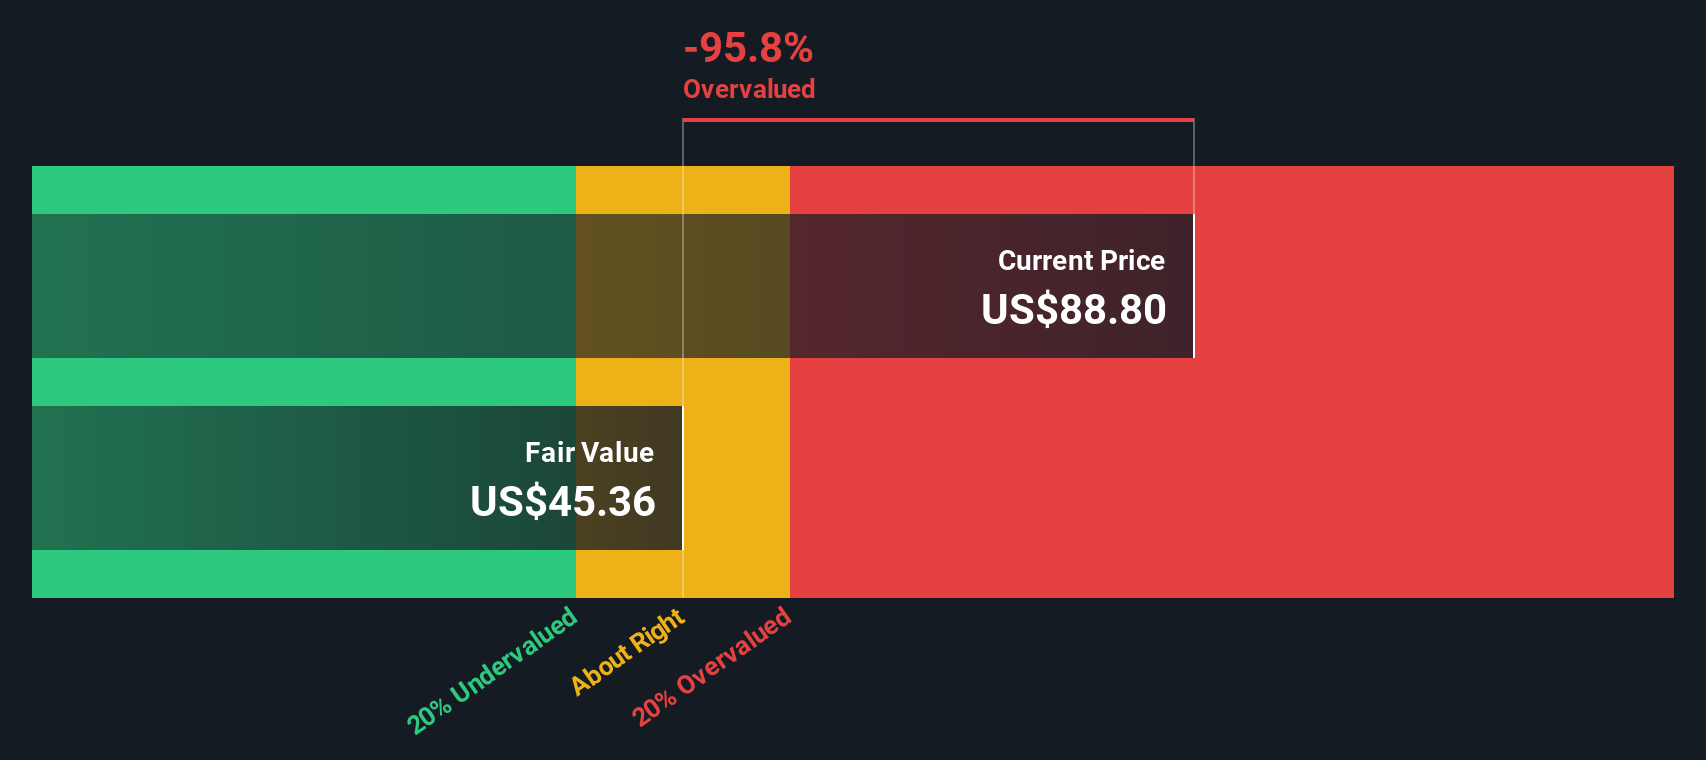
A Discounted Cash Flow model takes the cash Everus Construction Group is expected to generate in the future, then discounts those projections back into today’s dollars to estimate what the business is really worth now.
Everus currently generates about $137.7 Million in free cash flow. Analysts expect this to dip in the near term before gradually recovering, with Simply Wall St extrapolating free cash flow to roughly $142.9 Million by 2035. These projections, along with a final long term growth assumption, are discounted using a 2 Stage Free Cash Flow to Equity model to arrive at an intrinsic value of about $40.26 per share.
With the stock trading around $91.75, the DCF output suggests Everus is roughly 127.9% above this estimate, implying the market price is well ahead of the cash flows currently expected from the business.
Result: OVERVALUED
Our Discounted Cash Flow (DCF) analysis suggests Everus Construction Group may be overvalued by 127.9%. Discover 905 undervalued stocks or create your own screener to find better value opportunities.
Approach 2: Everus Construction Group Price vs Earnings
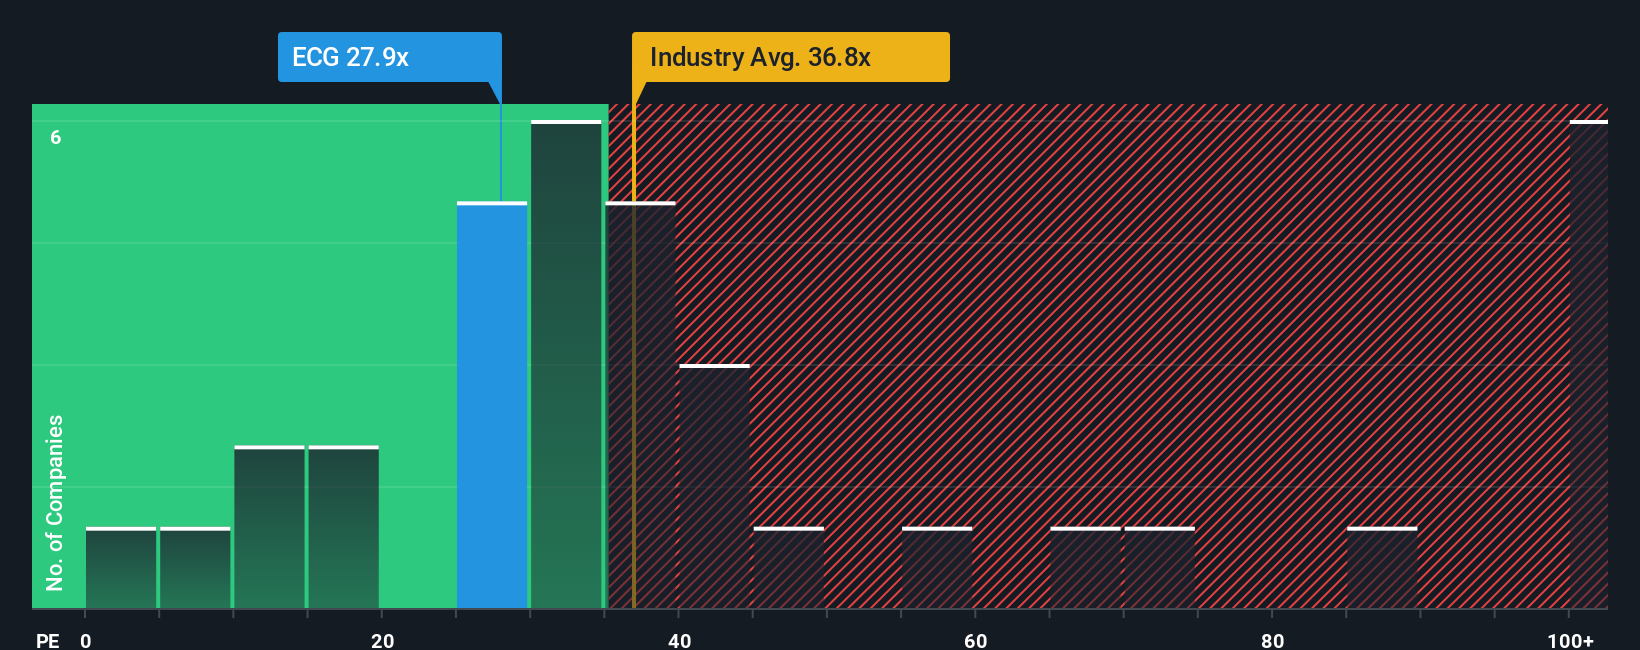
For profitable businesses like Everus Construction Group, the price to earnings, or PE, ratio is a straightforward way to gauge how much investors are willing to pay for each dollar of current earnings. In general, faster growing, less risky companies can justify a higher PE, while slower growth or higher uncertainty usually calls for a lower, more conservative multiple.
Everus currently trades on a PE of about 25.9x, which sits below the broader Construction industry average of around 34.5x, and also a bit under the 28.6x average of its direct peers. On the surface, that discount might make the stock look attractively priced, but simple comparisons can be misleading because they ignore company specific growth prospects, margins and risk.
This is where Simply Wall St’s Fair Ratio comes in. It estimates what a reasonable PE should be for Everus, given factors like its earnings growth outlook, profitability, industry positioning, market cap and risk profile. For Everus, the Fair Ratio is calculated at roughly 25.9x, almost identical to where the shares trade today. This suggests the current market price is broadly aligned with the company’s fundamentals.
Result: ABOUT RIGHT
PE ratios tell one story, but what if the real opportunity lies elsewhere? Discover 1440 companies where insiders are betting big on explosive growth.
Upgrade Your Decision Making: Choose your Everus Construction Group Narrative
Earlier we mentioned that there is an even better way to understand valuation, so let us introduce you to Narratives, a simple framework that lets you attach a clear story, your view of Everus Construction Group’s future revenue, earnings and margins, to the numbers behind a fair value estimate. A Narrative connects three things: what you believe about the business, how that belief translates into a financial forecast, and the fair value that drops out of those assumptions. On Simply Wall St’s Community page, used by millions of investors, Narratives are easy to explore and create, helping you quickly see whether your fair value sits above or below the current share price, and therefore whether Everus might be a buy, hold or sell for you. They also update dynamically as new information such as earnings, guidance or major news is released, so your view stays current without you rebuilding models from scratch. For example, one Everus Narrative might assume strong policy backed growth and a higher fair value, while another builds in slower construction demand and a lower fair value, giving two very different but transparent perspectives on the same stock.
Do you think there's more to the story for Everus Construction Group? Head over to our Community to see what others are saying!

This article by Simply Wall St is general in nature. We provide commentary based on historical data and analyst forecasts only using an unbiased methodology and our articles are not intended to be financial advice. It does not constitute a recommendation to buy or sell any stock, and does not take account of your objectives, or your financial situation. We aim to bring you long-term focused analysis driven by fundamental data. Note that our analysis may not factor in the latest price-sensitive company announcements or qualitative material. Simply Wall St has no position in any stocks mentioned.
Have feedback on this article? Concerned about the content? Get in touch with us directly. Alternatively, email editorial-team@simplywallst.com