
- PREMIUM
- LIVE QUOTES
- INSTITUTION
 Index Options
 State Street
 CME Group
 Nasdaq
 Cboe
Cboe TradingView
 Wall Street Journal
Is RH A Bargain After a 60% Slide and Growth Strategy Concerns in 2025?
- If you are wondering whether RH at around $160 a share is starting to look like a bargain or just a value trap, this breakdown is for you.
- The stock is roughly flat over the last week (up 0.3%) but still down 59.5% year to date and 56.9% over the last year. This represents a massive reset in expectations that has a lot of investors rethinking the risk reward.
- Much of that move has been shaped by shifting sentiment around high end discretionary spending and RH’s aggressive long term expansion strategy, including its focus on larger galleries and a push into new lines like hospitality and international markets. Investors are trying to figure out whether these moves justify riding out the current volatility or signal a structurally tougher road ahead.
- Right now RH scores a 3 out of 6 on our valuation checks, which suggests pockets of undervaluation but also some red flags. We will walk through the main valuation approaches next and then finish by looking at another way to judge whether the current price truly makes sense.
Find out why RH's -56.9% return over the last year is lagging behind its peers.
Approach 1: RH Discounted Cash Flow (DCF) Analysis
A Discounted Cash Flow, or DCF, estimates what a business is worth today by projecting its future cash flows and discounting them back into todays dollars. For RH, this model uses a 2 Stage Free Cash Flow to Equity approach based on cash flow projections in $.
RH is currently generating negative free cash flow of about $80 million, reflecting heavy investment and a tough macro backdrop, but analysts and internal estimates expect a sharp rebound. By 2026, free cash flow is projected at roughly $243 million, rising to about $360 million in 2028, and continuing to grow to an estimated $1.0 billion by 2035 as new galleries, international expansion, and hospitality initiatives mature. Simply Wall St uses analyst forecasts for the earlier years and then extrapolates beyond that horizon.
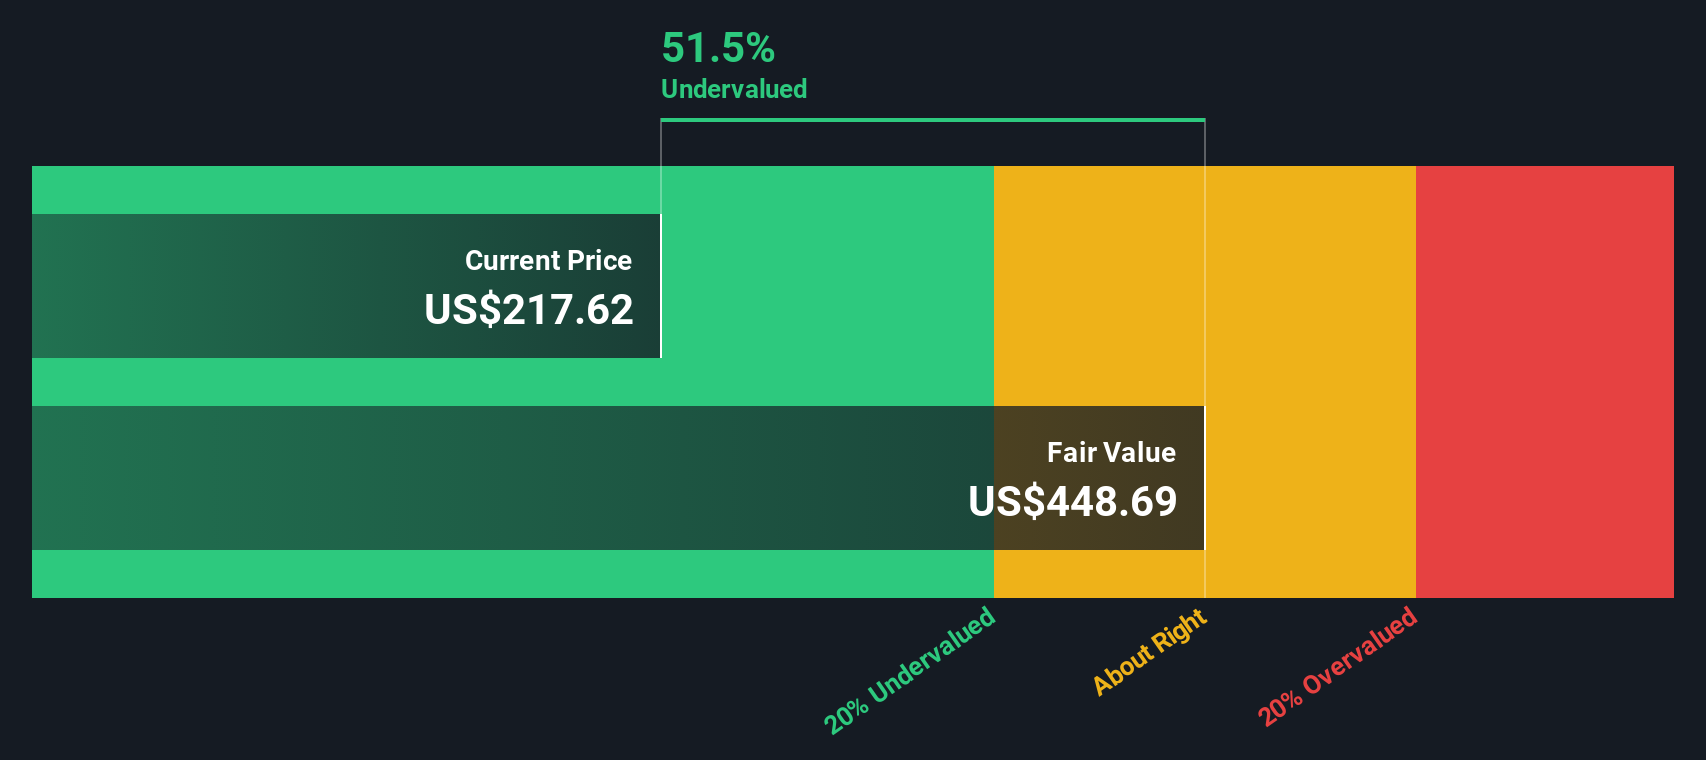
When all of those projected cash flows are discounted back, the intrinsic value comes out to roughly $387 per share, implying RH is trading at a 58.7% discount to its estimated fair value. On this basis, the stock screens as notably undervalued rather than a fully priced luxury story.
Result: UNDERVALUED
Our Discounted Cash Flow (DCF) analysis suggests RH is undervalued by 58.7%. Track this in your watchlist or portfolio, or discover 908 more undervalued stocks based on cash flows.
Approach 2: RH Price vs Earnings
For a profitable company like RH, the price to earnings ratio is a useful snapshot of how much investors are willing to pay today for each dollar of current earnings. It effectively rolls together expectations for future growth and the perceived risk of those earnings; faster, more reliable growth usually justifies a higher PE, while cyclicality or execution risk tends to push a “normal” or “fair” PE lower.
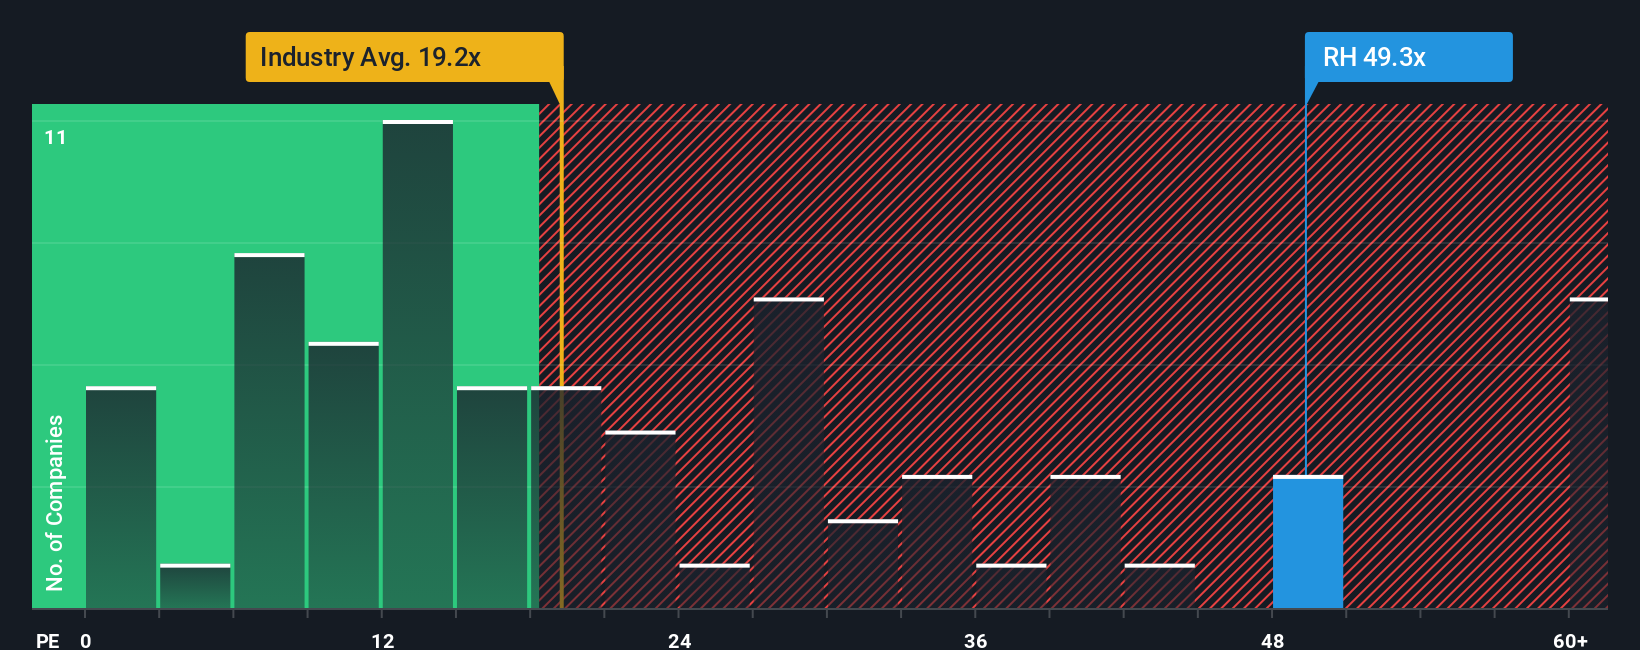
RH currently trades on a PE of about 28.1x, meaning the market is paying a noticeable premium to the Specialty Retail industry average of roughly 18.4x and close to the peer group’s 18.2x. On simple comparisons, that makes RH look expensive versus its direct competition. However, Simply Wall St’s proprietary Fair Ratio model, which estimates what RH’s PE should be after accounting for its earnings growth outlook, profitability, size, industry positioning and risk profile, suggests a fair PE closer to 34.1x.
Because this Fair Ratio builds in RH specific dynamics rather than just comparing it to a broad industry or a handful of peers, it is a more tailored yardstick. With the stock at 28.1x versus a fair 34.1x, RH screens as undervalued on a PE basis.
Result: UNDERVALUED
PE ratios tell one story, but what if the real opportunity lies elsewhere? Discover 1442 companies where insiders are betting big on explosive growth.
Upgrade Your Decision Making: Choose your RH Narrative
Earlier we mentioned that there is an even better way to understand valuation, so let's introduce you to Narratives, a simple way to connect your view of RH’s story to the numbers behind its future revenue, earnings and margins.
A Narrative on Simply Wall St is your own structured storyline for a company, where you spell out what you think will drive RH’s business over time and then link that view directly to a financial forecast and a fair value estimate.
Within the Community page on our platform, used by millions of investors, Narratives make it easy to turn a viewpoint like “European openings and immersive galleries will unlock value” into concrete assumptions that generate a fair value you can compare with today’s share price. This may help you decide whether RH looks like a buy, a hold or a sell.
Because Narratives are updated dynamically when new information arrives, such as earnings or macro news, they help you keep your valuation grounded in the latest data. You can see how optimistic investors, who currently see RH worth up to $436 per share, and more cautious investors, who see closer to $179, are simply expressing different stories about how its strategy, risks and margins will play out over time.
Do you think there's more to the story for RH? Head over to our Community to see what others are saying!

This article by Simply Wall St is general in nature. We provide commentary based on historical data and analyst forecasts only using an unbiased methodology and our articles are not intended to be financial advice. It does not constitute a recommendation to buy or sell any stock, and does not take account of your objectives, or your financial situation. We aim to bring you long-term focused analysis driven by fundamental data. Note that our analysis may not factor in the latest price-sensitive company announcements or qualitative material. Simply Wall St has no position in any stocks mentioned.
Have feedback on this article? Concerned about the content? Get in touch with us directly. Alternatively, email editorial-team@simplywallst.com