
- PREMIUM
- LIVE QUOTES
- INSTITUTION
 Index Options
 State Street
 CME Group
 Nasdaq
 Cboe
Cboe TradingView
 Wall Street Journal
Is It Too Late To Consider Merck After Its Recent 20.3% Share Price Jump?
- Wondering if Merck at around $100 a share still looks attractive or if the easy gains are behind it? This breakdown outlines key considerations to help you assess whether the current price reflects the company’s underlying value.
- After a sharp 20.3% jump over the last month, Merck has only edged up 1.0% over the past year and 49.3% over five years, a pattern that may indicate shifting market expectations around its long term growth and risk profile.
- Much of the recent move has been driven by ongoing optimism around Merck’s oncology franchise and its late stage pipeline, as investors look beyond near term noise toward potential durable cash flows from key therapies. At the same time, regulatory updates and expanding indications for existing drugs have reinforced the view that Merck could maintain a strong competitive position in critical treatment areas.
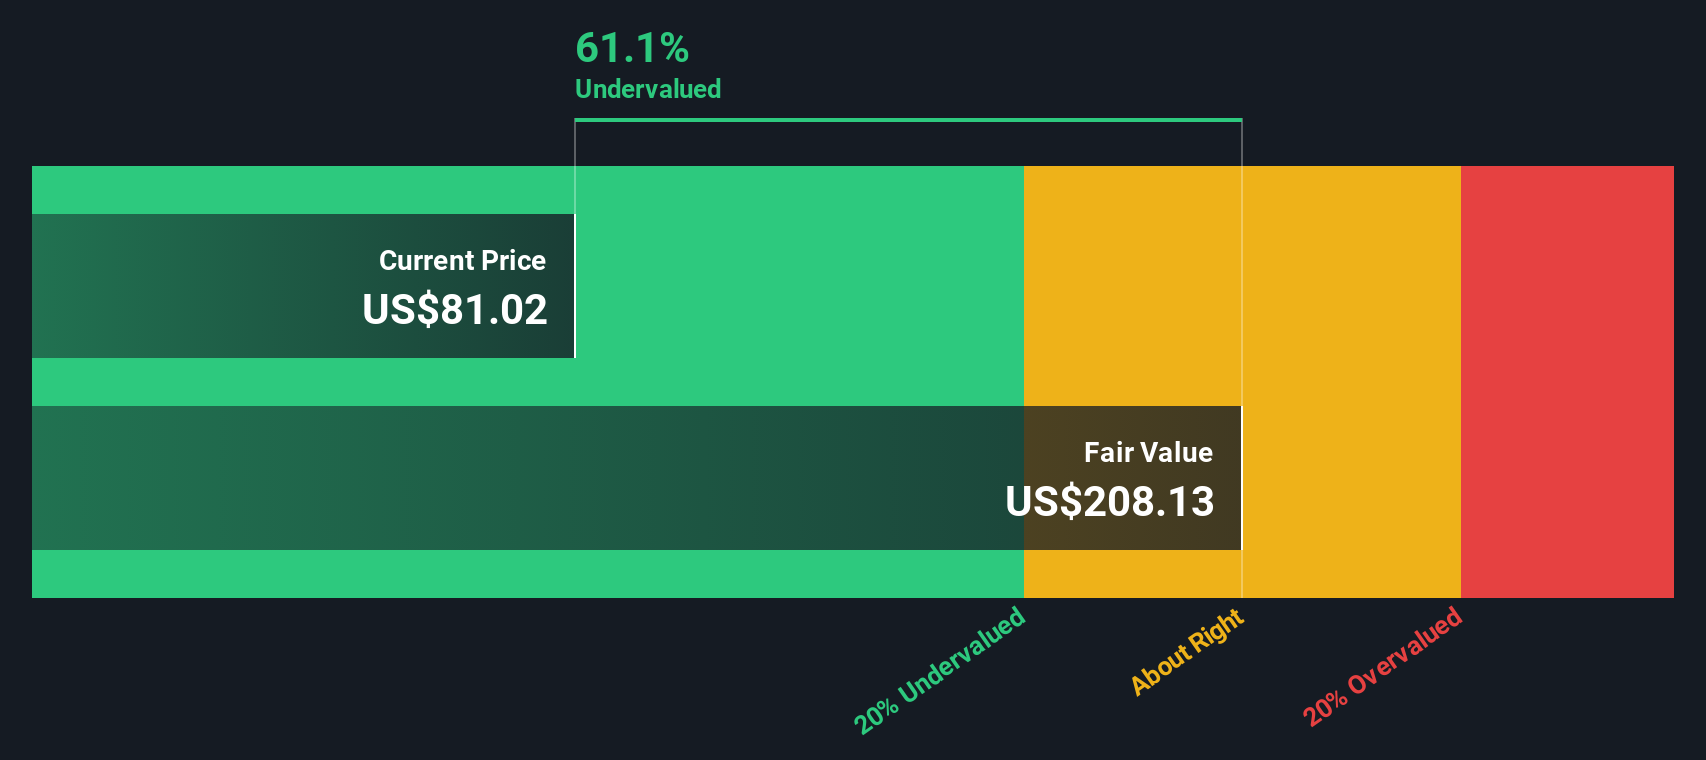
- Despite the mixed return picture, Merck currently scores a solid 5/6 on our undervaluation checks, suggesting the market may not be fully reflecting its fundamentals. Below, we outline the standard valuation approaches used to reach that view, followed by a broader framework for thinking about what Merck may be worth.
Find out why Merck's 1.0% return over the last year is lagging behind its peers.
Approach 1: Merck Discounted Cash Flow (DCF) Analysis
A Discounted Cash Flow model estimates what a company is worth by projecting the cash it can generate in the future and discounting those cash flows back to today in dollar terms.
For Merck, the 2 Stage Free Cash Flow to Equity model starts with last twelve month free cash flow of about $13.1 Billion and then applies analyst forecasts and longer term extrapolations. Analyst estimates have Merck’s free cash flow rising to around $23.1 Billion by 2026 and $25.2 Billion by 2027, with Simply Wall St extending these projections further to roughly $25.5 Billion by 2035 as growth gradually moderates.
When these future cash flows are discounted back and combined with an estimate of value beyond the explicit forecast period, the model arrives at an intrinsic value of roughly $216 per share. With the stock trading near $100, the DCF suggests Merck is about 53.3% undervalued, which may indicate that the market is underpricing the durability and growth of its cash generation.
Result: UNDERVALUED
Our Discounted Cash Flow (DCF) analysis suggests Merck is undervalued by 53.3%. Track this in your watchlist or portfolio, or discover 908 more undervalued stocks based on cash flows.
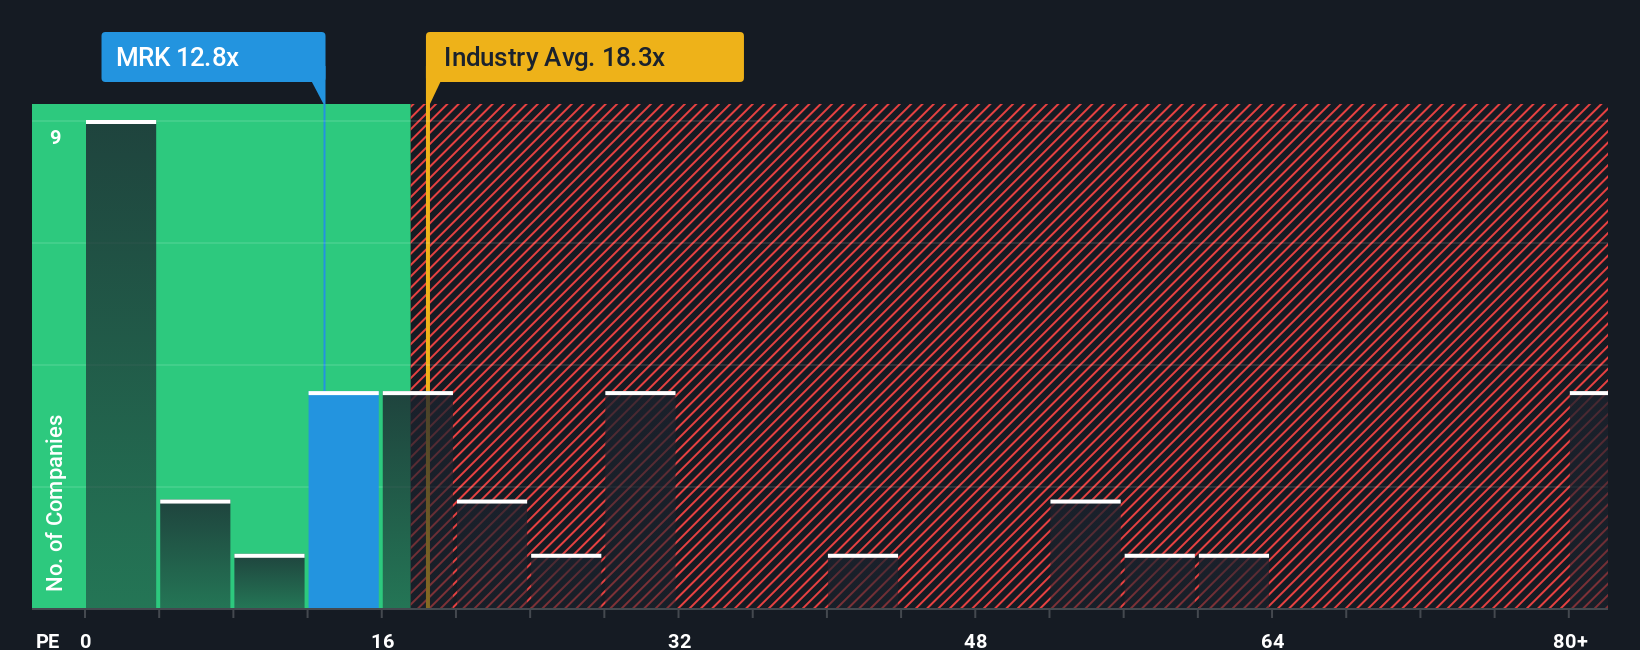
Approach 2: Merck Price vs Earnings
For profitable companies like Merck, the Price to Earnings, or PE, ratio is a straightforward way to see what investors are willing to pay for each dollar of current earnings. In general, higher expected growth and lower perceived risk are often associated with a higher PE, while slower growth or higher uncertainty are often associated with a lower multiple being considered normal or fair.
Merck currently trades on a PE of about 13.2x, which sits below both the broader Pharmaceuticals industry average of roughly 19.7x and the peer group average of around 18.0x. Simply Wall St also calculates a proprietary Fair Ratio of about 30.6x for Merck, which reflects what the PE might be expected to be once you factor in the company’s specific earnings growth outlook, profitability, industry, market cap and risk profile. This Fair Ratio is more tailored than a simple comparison with peers or industry averages because it adjusts for Merck’s own fundamentals rather than assuming all drug makers deserve similar valuations.
Comparing Merck’s current 13.2x PE to the Fair Ratio of 30.6x indicates that the shares trade at a meaningful discount to what its fundamentals might warrant.
Result: UNDERVALUED
PE ratios tell one story, but what if the real opportunity lies elsewhere? Discover 1442 companies where insiders are betting big on explosive growth.
Upgrade Your Decision Making: Choose your Merck Narrative
Earlier we mentioned that there is an even better way to understand valuation, so let us introduce you to Narratives, a simple way to attach your own story about Merck to the numbers by linking what you believe about its future revenue, earnings and margins to a financial forecast and then to a Fair Value estimate. On Simply Wall St’s Community page, millions of investors can create or follow these Narratives, which turn assumptions into a clear Fair Value that can be compared with today’s share price to highlight when Merck might be a buy, a sell, or worth holding. Because Narratives are updated dynamically as fresh information arrives, such as pipeline news, deals or earnings results, they stay relevant instead of going stale after one report. For example, one optimistic Merck Narrative might lean into the expanding late stage pipeline and arrive at a Fair Value closer to the high analyst target of about $141. A more cautious view focused on Keytruda’s patent expiry and pricing pressure might sit nearer the low end around $82, giving you a transparent range of outcomes to benchmark your own judgment against.
Do you think there's more to the story for Merck? Head over to our Community to see what others are saying!

This article by Simply Wall St is general in nature. We provide commentary based on historical data and analyst forecasts only using an unbiased methodology and our articles are not intended to be financial advice. It does not constitute a recommendation to buy or sell any stock, and does not take account of your objectives, or your financial situation. We aim to bring you long-term focused analysis driven by fundamental data. Note that our analysis may not factor in the latest price-sensitive company announcements or qualitative material. Simply Wall St has no position in any stocks mentioned.
Have feedback on this article? Concerned about the content? Get in touch with us directly. Alternatively, email editorial-team@simplywallst.com