
- PREMIUM
- LIVE QUOTES
- INSTITUTION
 Index Options
 State Street
 CME Group
 Nasdaq
 Cboe
Cboe TradingView
 Wall Street Journal
Has the Market Mispriced Harmonic After a 26.8% Drop in 2025?
- Wondering if Harmonic at around $9.58 is a bargain or a value trap? You are not alone, and this is where a closer look at valuation really starts to matter.
- The stock has been choppy lately, up just 0.2% over the last week but still down 8.2% over the past month and 26.8% year to date. This hints that sentiment has cooled, even as the long term 5 year return of 36.7% tells a more optimistic story.
- Recently, investors have been weighing shifting expectations around Harmonic's broadband and video infrastructure demand, as network upgrade cycles and customer spending plans have become more uncertain. At the same time, the market has been reacting to industry wide headlines about capital spending restraint from telecom and cable operators, which tends to hit companies like Harmonic first in the share price.
- Despite that backdrop, Harmonic still clocks a solid valuation score of 5 out of 6, suggesting it screens as undervalued on most of our checks. Next, we will break down how different valuation methods see the stock today, before finishing with a more holistic way to judge what it is really worth.
Find out why Harmonic's -25.7% return over the last year is lagging behind its peers.
Approach 1: Harmonic Discounted Cash Flow (DCF) Analysis
A Discounted Cash Flow model estimates what a company is worth today by projecting the cash it can generate in the future and discounting those cash flows back to their value in $ today.
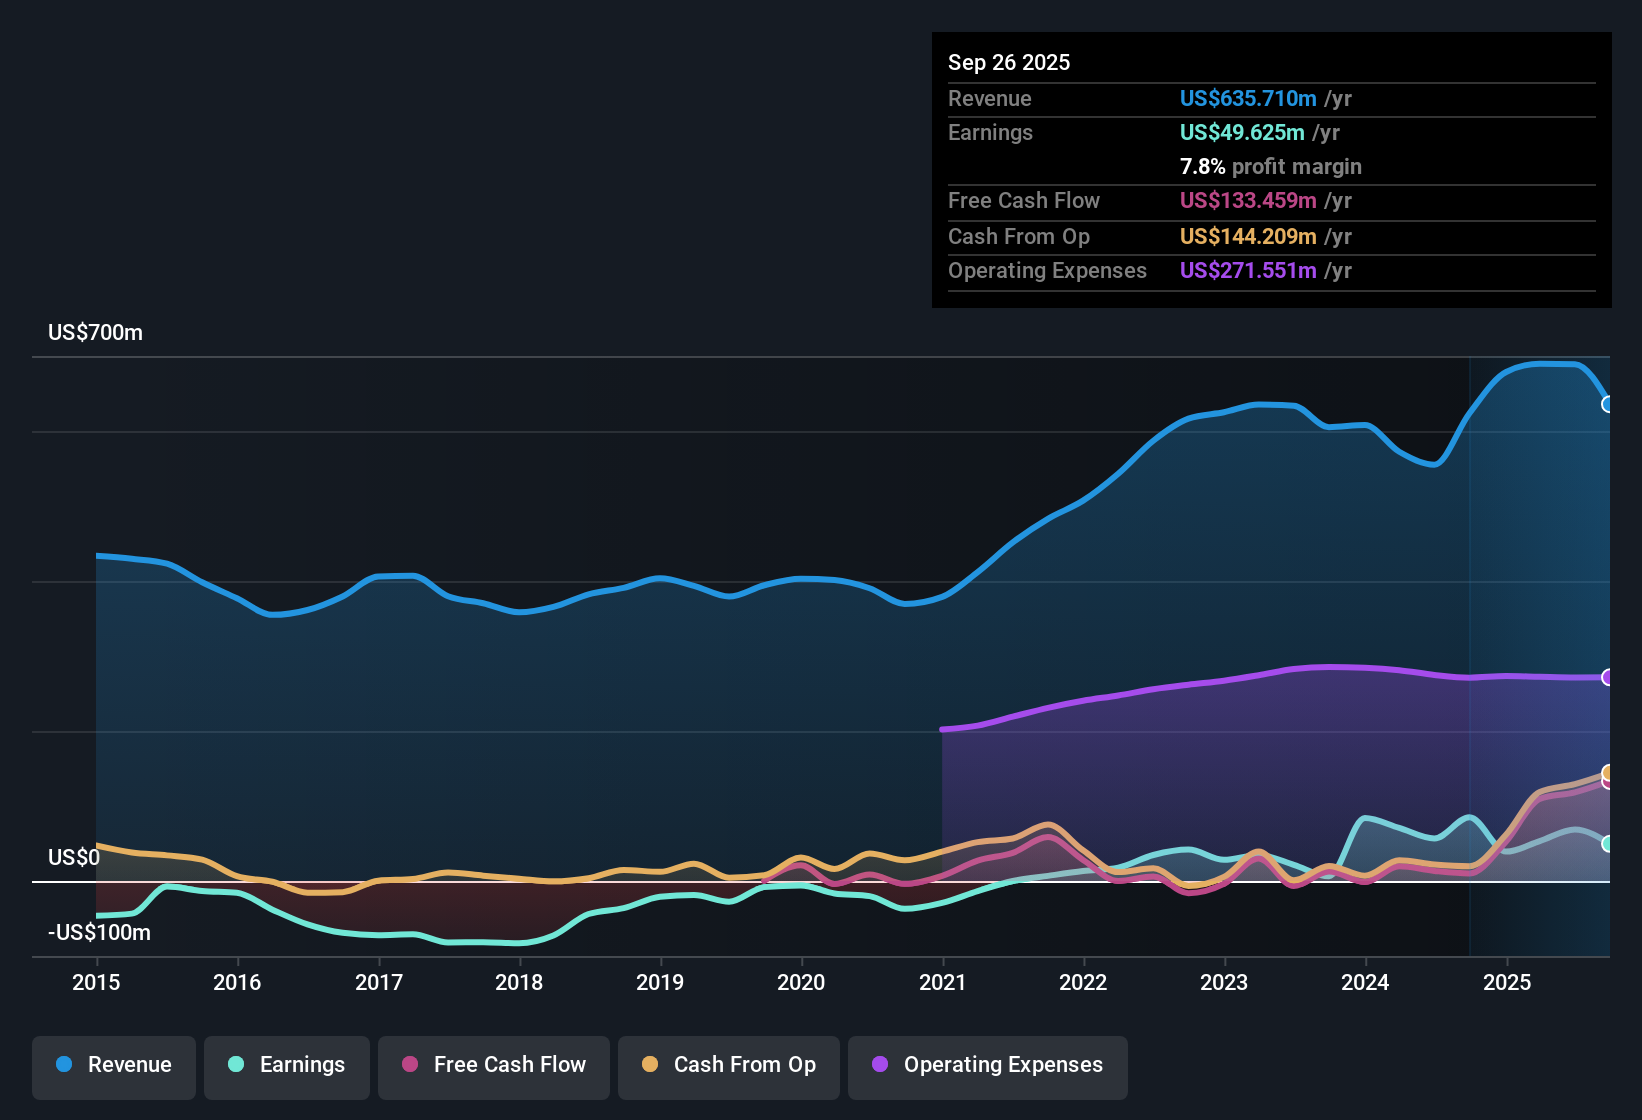
For Harmonic, the latest twelve month Free Cash Flow is about $134.7 million. Using analyst expectations for the near term and then extrapolating further out, the model projects Free Cash Flow rising to roughly $1.54 billion by 2035, with growth slowing over time as the business matures. These cash flows are projected in $ and then discounted using a 2 Stage Free Cash Flow to Equity approach.
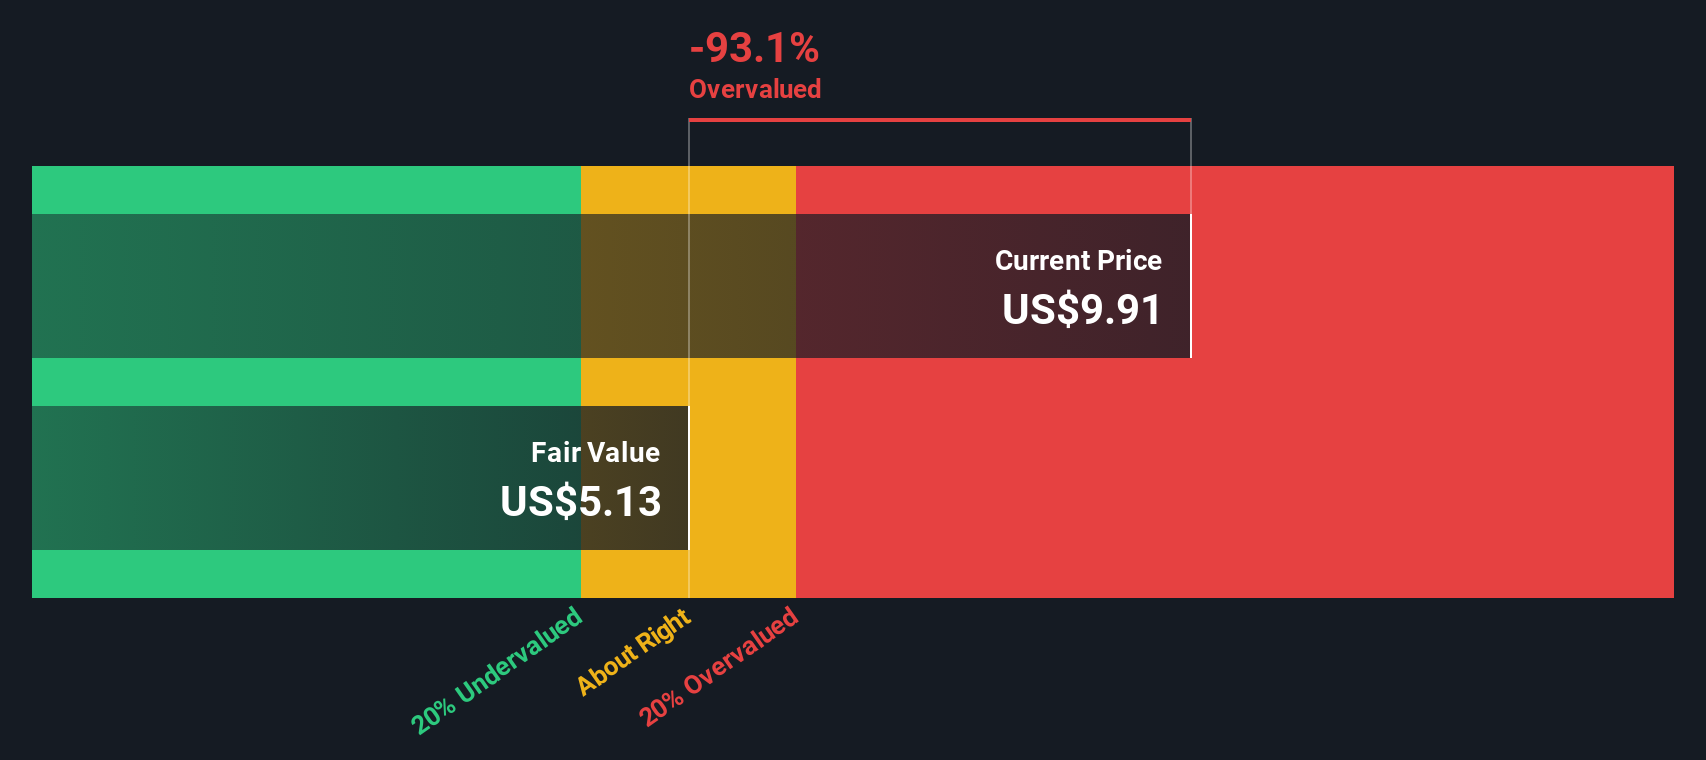
Based on these projections, the DCF model arrives at an estimated intrinsic value of about $173.93 per share. Compared with the current share price around $9.58, this implies the shares trade at roughly a 94.5% discount to the modelled fair value. On this framework, the stock appears deeply undervalued.
Result: UNDERVALUED
Our Discounted Cash Flow (DCF) analysis suggests Harmonic is undervalued by 94.5%. Track this in your watchlist or portfolio, or discover 909 more undervalued stocks based on cash flows.
Approach 2: Harmonic Price vs Earnings
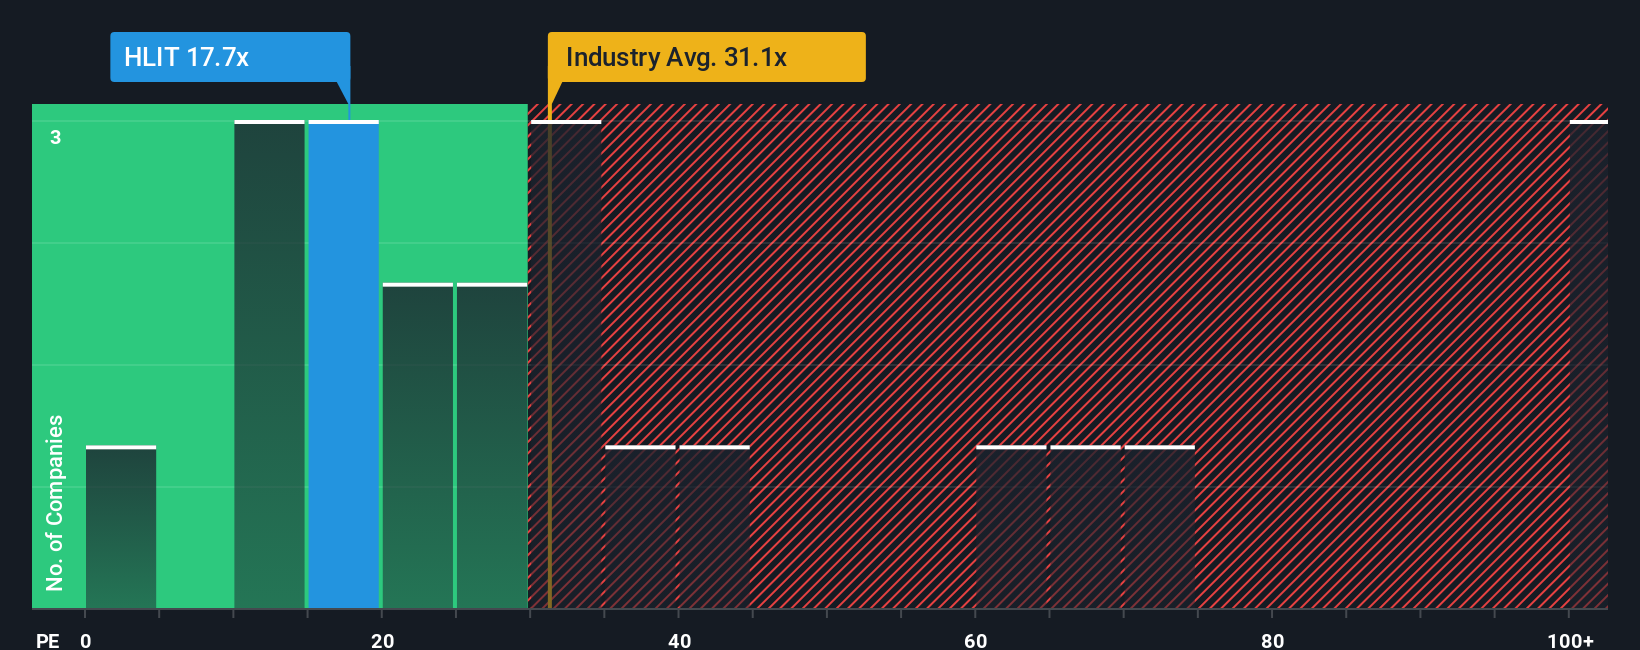
For a profitable company like Harmonic, the Price to Earnings, or PE, ratio is a useful yardstick because it links the share price directly to the profits the business is generating today. In general, higher growth prospects and lower perceived risk justify a higher “normal” PE multiple, while slower growth or greater uncertainty usually cap what investors are willing to pay.
Harmonic currently trades on a PE of about 21.7x, which sits below both the Communications industry average of around 31.9x and the peer group average of roughly 26.9x. On simple comparisons, that suggests the stock is priced more conservatively than many of its rivals. However, Simply Wall St’s Fair Ratio framework goes a step further by estimating what PE multiple would be appropriate for Harmonic specifically, based on its earnings growth outlook, profitability, industry, market cap and risk profile.
For Harmonic, this Fair Ratio comes out at about 39.6x, well above the current 21.7x. That gap indicates the market is assigning a significantly lower multiple than the company’s fundamentals might warrant, and this points to meaningful upside potential if sentiment normalizes.
Result: UNDERVALUED
PE ratios tell one story, but what if the real opportunity lies elsewhere? Discover 1442 companies where insiders are betting big on explosive growth.
Upgrade Your Decision Making: Choose your Harmonic Narrative
Earlier we mentioned that there is an even better way to understand valuation, so let us introduce Narratives, a simple way to attach your own story about Harmonic to the numbers by linking what you believe about its future revenue, earnings and margins to a financial forecast and then to a fair value estimate that you can directly compare to today’s share price.
On Simply Wall St’s Community page, Narratives are an easy to use tool that millions of investors access to turn their views into forecasts, helping them judge whether Harmonic looks like a buy, hold or sell as its Fair Value line moves against the live market price.
Because Narratives are dynamic, they automatically update when new information arrives, such as earnings results, industry news or guidance changes, so your fair value view does not go stale.
For example, one Harmonic investor might build a bullish Narrative that assumes faster broadband rollout, higher margins and a fair value closer to the optimistic 12.5 dollar target. Another might take a more cautious view, expecting slower growth and a fair value nearer 7 dollars. Both perspectives can coexist transparently on the platform so you can see exactly which assumptions you agree with.
Do you think there's more to the story for Harmonic? Head over to our Community to see what others are saying!
This article by Simply Wall St is general in nature. We provide commentary based on historical data and analyst forecasts only using an unbiased methodology and our articles are not intended to be financial advice. It does not constitute a recommendation to buy or sell any stock, and does not take account of your objectives, or your financial situation. We aim to bring you long-term focused analysis driven by fundamental data. Note that our analysis may not factor in the latest price-sensitive company announcements or qualitative material. Simply Wall St has no position in any stocks mentioned.
Have feedback on this article? Concerned about the content? Get in touch with us directly. Alternatively, email editorial-team@simplywallst.com