
- PREMIUM
- LIVE QUOTES
- INSTITUTION
 Index Options
 State Street
 CME Group
 Nasdaq
 Cboe
Cboe TradingView
 Wall Street Journal
Tsubakimoto Chain (TSE:6371): Valuation Check After New AI Logistics Alliance with Kioxia and EAGLYS
Tsubakimoto Chain (TSE:6371) is back in the spotlight after teaming up with Kioxia and EAGLYS on an AI powered image recognition system for logistics, a move that could quietly reshape its growth story.
See our latest analysis for Tsubakimoto Chain.
That AI collaboration lands on top of a completed share buyback program, and investors seem to be warming to the story, with a roughly 17% year to date share price return and an impressive multi year total shareholder return suggesting momentum is building rather than fading.
If this kind of automation shift has your attention, it could be worth scanning high growth tech and AI stocks to spot other names quietly positioning themselves for the next leg of AI driven growth.
But with earnings growth stalling, a completed buyback and the share price now sitting above analyst targets, is Tsubakimoto Chain still flying under the radar, or is the market already pricing in its next leg of AI driven growth?
Price-to-Earnings of 9.8x: Is it justified?
Tsubakimoto Chain trades on a 9.8x price-to-earnings multiple against a last close of ¥2,219, a level that looks modest versus peers and the wider Japanese market.
The price-to-earnings ratio compares the current share price to the company’s earnings per share, giving a quick sense of how much investors pay for each unit of profit. For an established industrial and machinery name with a long operating history, this metric is a widely watched yardstick of how the market values current and near term earnings power.
On that basis, Tsubakimoto Chain screens as relatively low on valuation metrics, with its 9.8x multiple sitting below both the peer average of 16.9x and the JP Machinery industry average of 12.6x. It also trades under the broader JP market on 14.1x. Our estimated fair price-to-earnings ratio of 11.5x indicates a gap between the current level and that reference point, depending on how sentiment and earnings visibility develop.
Explore the SWS fair ratio for Tsubakimoto Chain
Result: Price-to-Earnings of 9.8x
However, stalled earnings growth and a share price already above analyst targets could limit upside if AI execution or broader industrial demand disappoints.
Find out about the key risks to this Tsubakimoto Chain narrative.
Another View: Our DCF Signals Caution
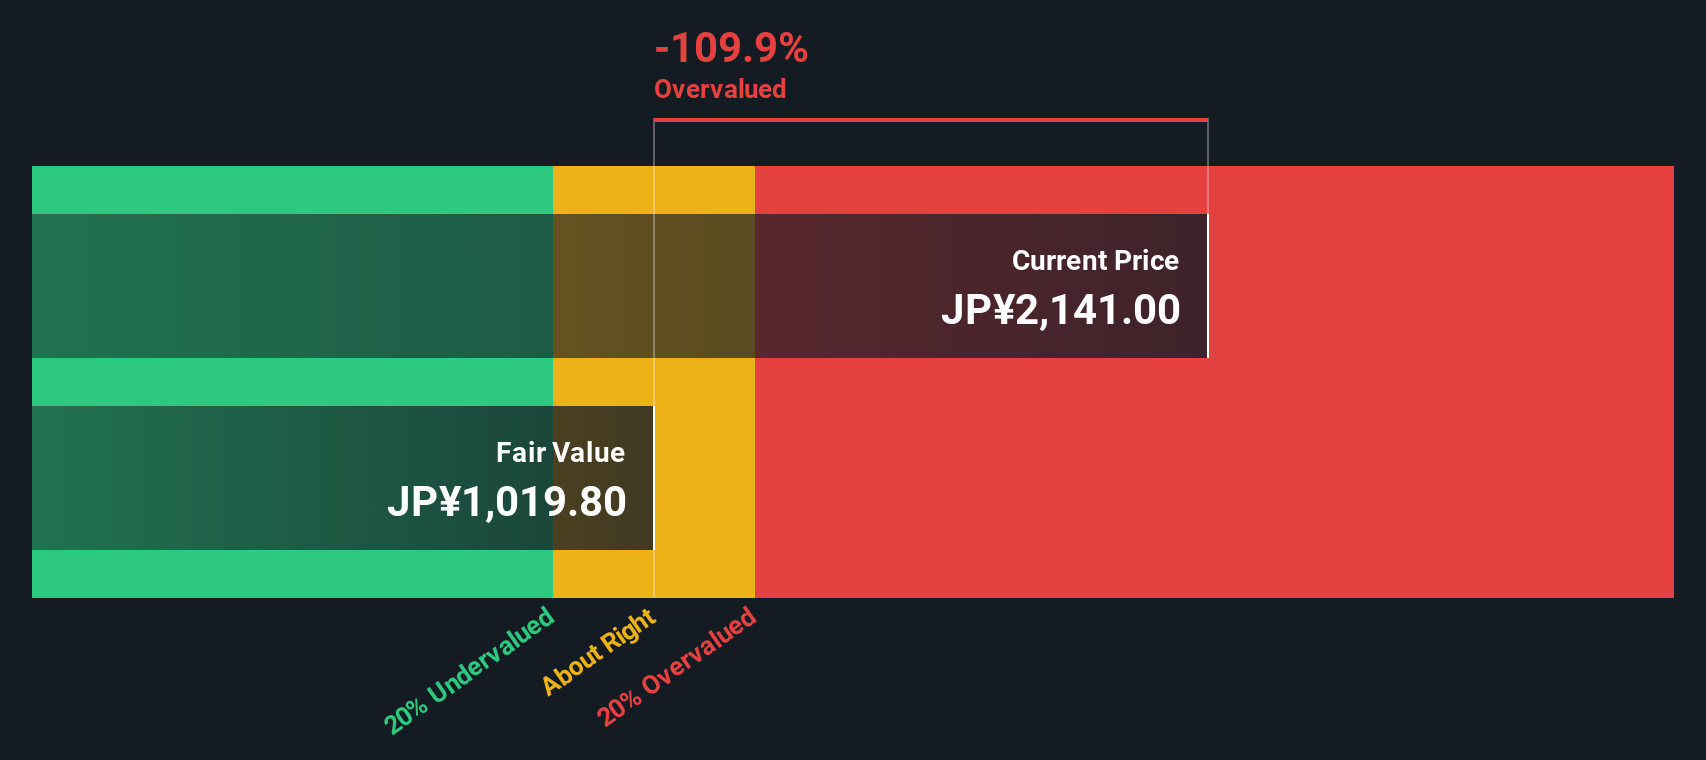
While the 9.8x earnings multiple suggests Tsubakimoto Chain looks cheap against peers, our SWS DCF model paints a tougher picture and puts fair value near ¥1,024 per share. On that basis, the current ¥2,219 price screens as meaningfully overvalued and raises the question of how much future AI optimism is already baked in.
Look into how the SWS DCF model arrives at its fair value.
Simply Wall St performs a discounted cash flow (DCF) on every stock in the world every day (check out Tsubakimoto Chain for example). We show the entire calculation in full. You can track the result in your watchlist or portfolio and be alerted when this changes, or use our stock screener to discover 912 undervalued stocks based on their cash flows. If you save a screener we even alert you when new companies match - so you never miss a potential opportunity.
Build Your Own Tsubakimoto Chain Narrative
If you see the story differently or would rather dig into the numbers yourself, you can build a fresh view in minutes with Do it your way.
A great starting point for your Tsubakimoto Chain research is our analysis highlighting 4 key rewards and 2 important warning signs that could impact your investment decision.
Ready for your next investing move?
Do not stop with one opportunity. Use the Simply Wall St Screener to quickly uncover fresh ideas that match your style before the market reacts.
- Capture big upside potential early by targeting these 3572 penny stocks with strong financials that already show robust financial foundations instead of speculative hype.
- Strengthen your portfolio’s growth engine by focusing on these 26 AI penny stocks poised to benefit from real world AI adoption rather than short lived headlines.
- Lock in quality income streams by scanning these 15 dividend stocks with yields > 3% that can help support long term returns even when markets turn volatile.
This article by Simply Wall St is general in nature. We provide commentary based on historical data and analyst forecasts only using an unbiased methodology and our articles are not intended to be financial advice. It does not constitute a recommendation to buy or sell any stock, and does not take account of your objectives, or your financial situation. We aim to bring you long-term focused analysis driven by fundamental data. Note that our analysis may not factor in the latest price-sensitive company announcements or qualitative material. Simply Wall St has no position in any stocks mentioned.
Have feedback on this article? Concerned about the content? Get in touch with us directly. Alternatively, email editorial-team@simplywallst.com