
- PREMIUM
- LIVE QUOTES
- INSTITUTION
 Index Options
 State Street
 CME Group
 Nasdaq
 Cboe
Cboe TradingView
 Wall Street Journal
Is Synopsys Fairly Priced After Recent Rally and Strong AI Chip Design Momentum?
- If you are wondering whether Synopsys at around $463 a share is a bargain or fully priced, you are not alone. This article is going to unpack what the current market is really implying about its value.
- Despite being down 3.9% year to date and 10.4% over the last year, the stock has bounced sharply with a 10.9% gain in the last week and 13.4% over the past month, reminding investors that over the long term it is still up 42.4% over three years and 96.2% over five.
- Behind these moves, the market has been reacting to Synopsys cementing its role at the heart of semiconductor design and AI driven chip development. EDA software and IP remain critical for the next wave of computing, and ongoing industry focus on chip supply chains, design complexity, and AI workloads has kept high quality design platforms like Synopsys firmly on investors' radar.
- Yet, when we put Synopsys through our own valuation lens, it currently scores just 0 out of 6 on our value checks. Next we will break down what traditional valuation approaches say about the stock, before ending with a more holistic way to think about its true worth.
Synopsys scores just 0/6 on our valuation checks. See what other red flags we found in the full valuation breakdown.
Approach 1: Synopsys Discounted Cash Flow (DCF) Analysis
A Discounted Cash Flow model estimates what a company is worth by projecting its future cash flows and then discounting them back to today, so you can compare that value directly to the share price.
For Synopsys, the model starts with last twelve month Free Cash Flow of about $1.26 billion. Analysts provide detailed forecasts for the next few years, and beyond that Simply Wall St extrapolates the trajectory. This results in projected Free Cash Flow of roughly $5.26 billion by 2030 as the business scales with chip design and AI demand.
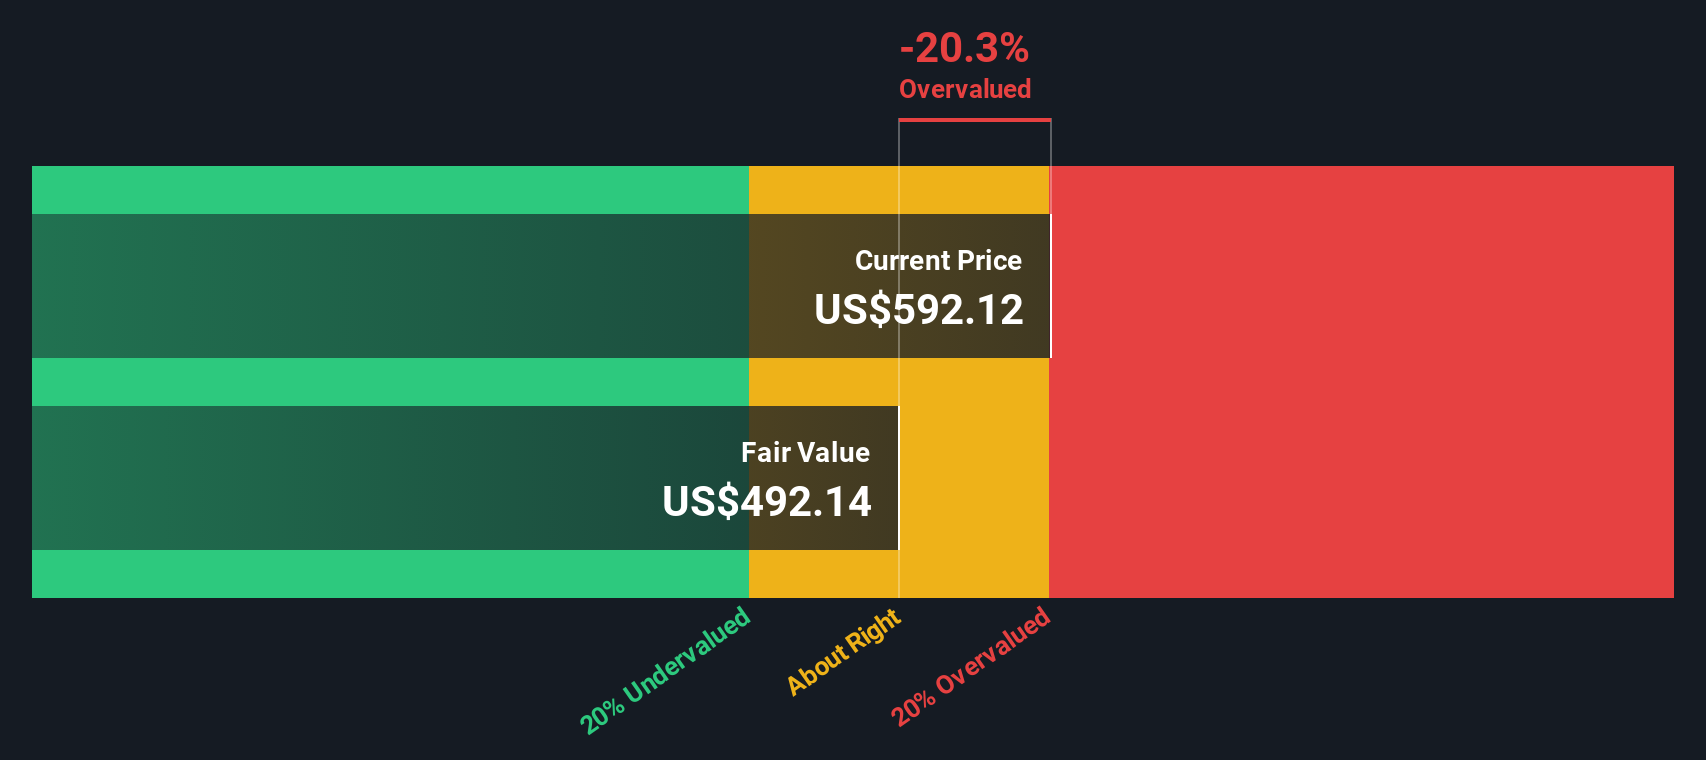
Putting all of those projected cash flows together and discounting them appropriately gives an estimated intrinsic value of around $460.73 per share. With the stock trading near $463, the DCF implies it is about 0.7% overvalued, which is effectively in the margin of error for this kind of model.
In other words, on cash flow fundamentals, Synopsys looks fairly close to fully valued at current levels rather than clearly cheap or expensive.
Result: ABOUT RIGHT
Synopsys is fairly valued according to our Discounted Cash Flow (DCF), but this can change at a moment's notice. Track the value in your watchlist or portfolio and be alerted on when to act.
Approach 2: Synopsys Price vs Earnings
For profitable, established businesses like Synopsys, the Price to Earnings ratio is a straightforward way to gauge how much investors are willing to pay for each dollar of current earnings. Higher growth prospects and lower perceived risk usually justify a higher PE ratio, while slower growth or greater uncertainty should result in a lower, more conservative multiple.
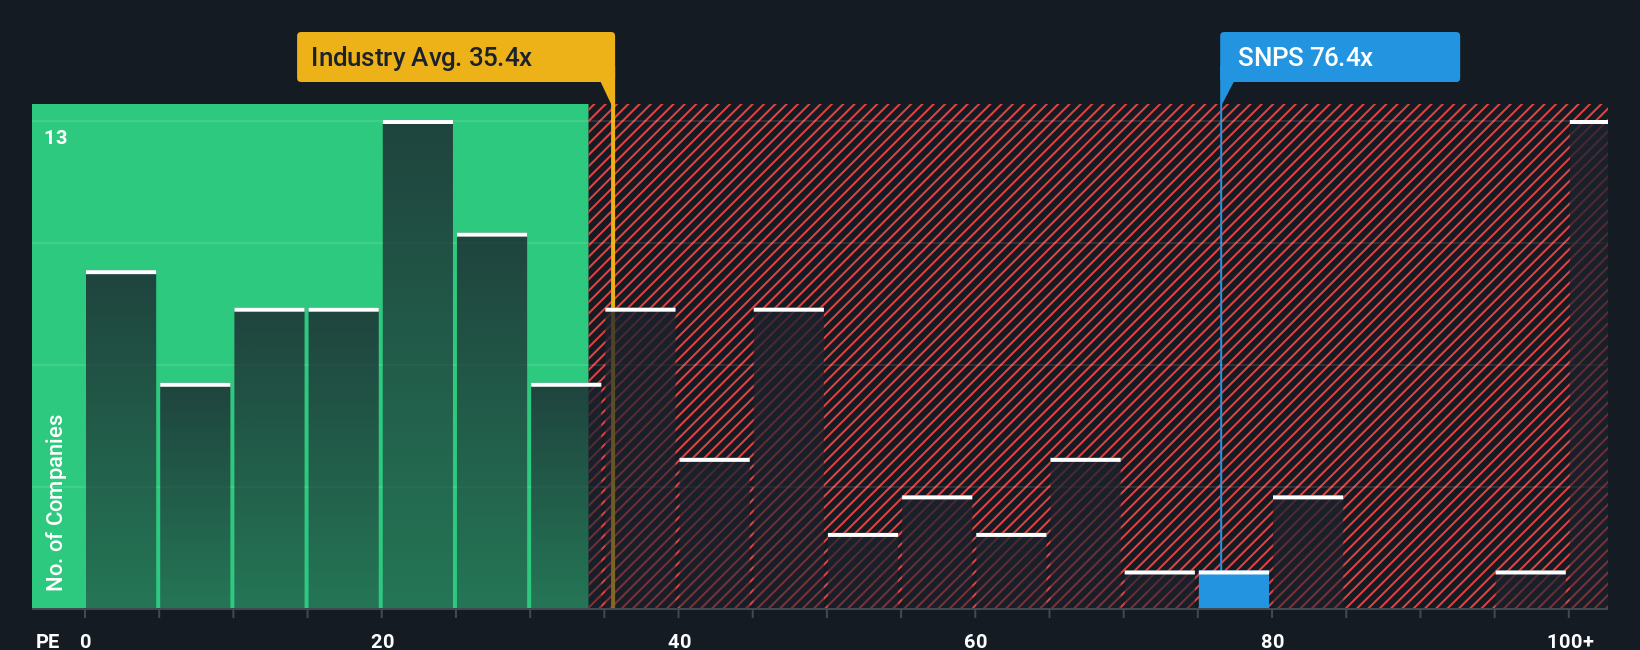
Synopsys currently trades on about 75.7x earnings, well above both the broader Software industry average of roughly 31.4x and the peer group average of around 66.0x. To go a step further, Simply Wall St uses a proprietary Fair Ratio model, which estimates what a more appropriate PE should be after factoring in Synopsys earnings growth outlook, profitability, industry, market cap and specific risks.
On this basis, Synopsys Fair Ratio comes out at about 43.4x, which is materially lower than the current 75.7x. This suggests that while the market is clearly excited about Synopsys strategic positioning in chip design and AI, the stock price is already discounting a very optimistic future compared to what the fundamentals currently support.
Result: OVERVALUED
PE ratios tell one story, but what if the real opportunity lies elsewhere? Discover 1442 companies where insiders are betting big on explosive growth.
Upgrade Your Decision Making: Choose your Synopsys Narrative
Earlier we mentioned that there is an even better way to understand valuation, so let us introduce you to Narratives, which are simply the stories investors tell about a company and then translate into numbers like future revenue, earnings, margins and a fair value estimate.
A Narrative connects three building blocks: your view of Synopsys business story, the forecast you think is realistic, and the fair value that drops out of those assumptions, making it much easier to see whether the current price lines up with what you believe.
On Simply Wall St, Narratives live inside the Community page and are designed to be straightforward and accessible, so millions of investors can quickly compare fair value estimates to the live share price to decide if Synopsys looks buyable, holdable, or worth trimming.
Because Narratives are updated dynamically as new information lands, like earnings surprises, guidance changes, lawsuits, partnerships or major deals, your view of fair value stays in sync with the latest data rather than going stale on a spreadsheet.
For example, one bullish Synopsys Narrative might lean on analysts consensus and see fair value closer to about $715, while a more cautious view might anchor around $550. By exploring both, you can decide which story and valuation best fit your own expectations before you act.
Do you think there's more to the story for Synopsys? Head over to our Community to see what others are saying!

This article by Simply Wall St is general in nature. We provide commentary based on historical data and analyst forecasts only using an unbiased methodology and our articles are not intended to be financial advice. It does not constitute a recommendation to buy or sell any stock, and does not take account of your objectives, or your financial situation. We aim to bring you long-term focused analysis driven by fundamental data. Note that our analysis may not factor in the latest price-sensitive company announcements or qualitative material. Simply Wall St has no position in any stocks mentioned.
Have feedback on this article? Concerned about the content? Get in touch with us directly. Alternatively, email editorial-team@simplywallst.com