
- PREMIUM
- LIVE QUOTES
- INSTITUTION
 Index Options
 State Street
 CME Group
 Nasdaq
 Cboe
Cboe TradingView
 Wall Street Journal
Is Realty Income Stock Now Attractive After Its 10.7% 2025 Rally?
- If you have ever wondered whether Realty Income is still a buy at today’s price, you are not alone. This breakdown is aimed squarely at that question.
- The stock has quietly climbed 1.9% over the last week, 3.7% over the past month, and is up 10.7% year to date, which hints that investor sentiment around this REIT may be warming again.
- Some of this renewed interest ties back to Realty Income’s continued deal making in the net lease space and its reputation for monthly dividends, which keeps income focused investors paying attention. At the same time, shifting expectations around interest rate cuts and the broader commercial real estate outlook have added extra volatility to how the market prices its future cash flows.
- On our framework, Realty Income currently scores a 2 out of 6 valuation checks. This suggests that while it looks undervalued on some metrics, others flash more caution. In the sections ahead we will unpack those methods and then finish with an even more intuitive way to think about its true value.
Realty Income scores just 2/6 on our valuation checks. See what other red flags we found in the full valuation breakdown.
Approach 1: Realty Income Discounted Cash Flow (DCF) Analysis
A DCF model takes Realty Income’s adjusted funds from operations, projects them into the future, and then discounts those cash flows back to today’s value to estimate what the shares are worth.
Realty Income generated about $3.6 billion of free cash flow over the last twelve months. Analysts expect this to rise steadily, with projections reaching roughly $4.7 billion by 2029 and continuing to grow modestly thereafter, based on a 2 stage free cash flow to equity model that blends analyst estimates with Simply Wall St extrapolations.
When all those projected cash flows are discounted back to today, the model arrives at an intrinsic value of about $97.70 per share. That implies the stock is trading at a 40.4% discount to its estimated fair value, which suggests that, on cash flow grounds, the market is being notably cautious about Realty Income’s future.
Result: UNDERVALUED
Our Discounted Cash Flow (DCF) analysis suggests Realty Income is undervalued by 40.4%. Track this in your watchlist or portfolio, or discover 912 more undervalued stocks based on cash flows.

Approach 2: Realty Income Price vs Earnings
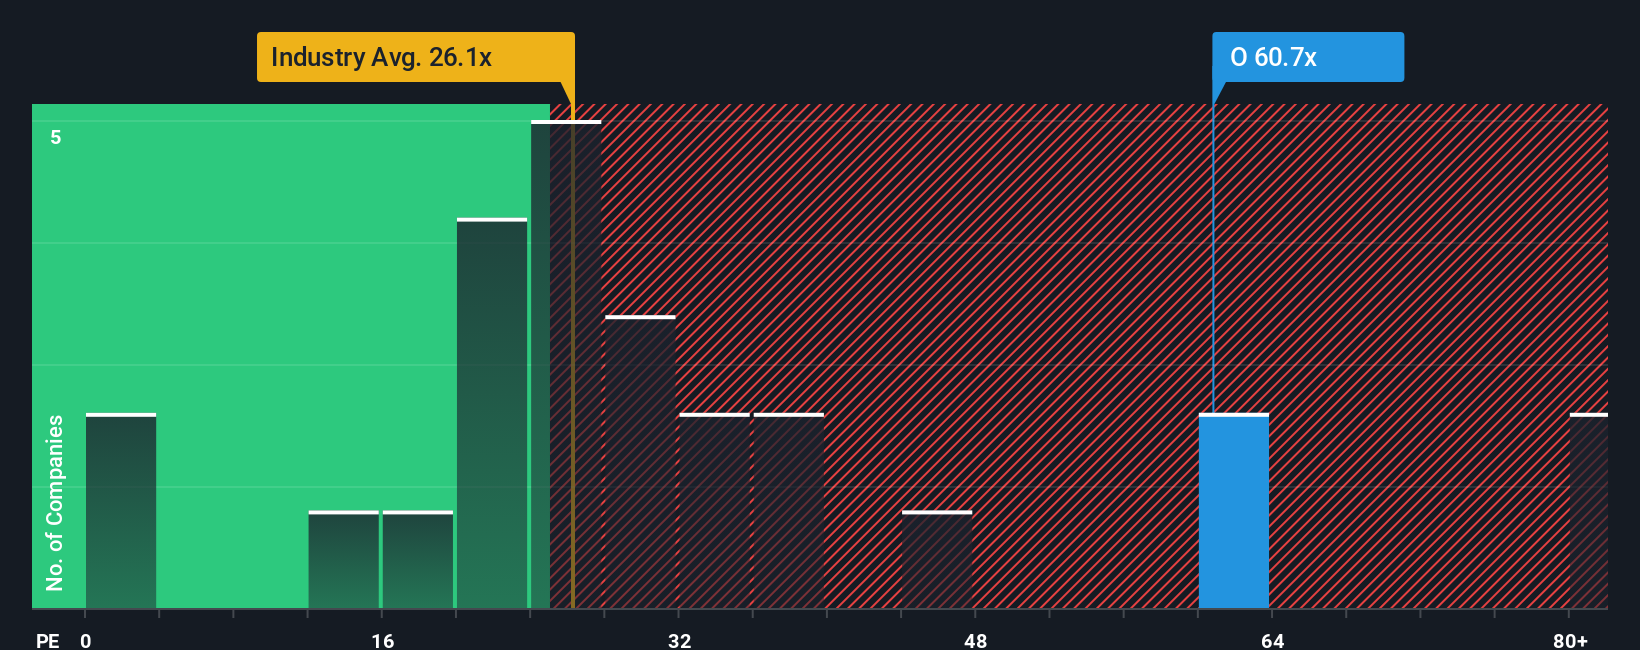
For a profitable, established REIT like Realty Income, the price to earnings, or PE, ratio is a useful way to gauge how much investors are paying for each dollar of current earnings. In general, companies with stronger growth prospects and lower perceived risk tend to justify higher PE ratios, while slower growing or riskier businesses usually warrant lower multiples.
Realty Income currently trades on a PE of about 55.66x, which is well above both the Retail REITs industry average of roughly 26.43x and the broader peer average of around 32.22x. Simply Wall St’s proprietary Fair Ratio model, which estimates what a reasonable PE should be after factoring in Realty Income’s earnings growth outlook, profitability, risk profile, industry, and market cap, points to a Fair Ratio of about 34.60x. This company specific lens is more informative than a simple comparison with peers or the sector, because it adjusts for differences in quality, growth, and risk rather than assuming all REITs deserve the same multiple.
With the actual PE of 55.66x sitting notably above the 34.60x Fair Ratio, the stock screens as overvalued on this earnings multiple view.
Result: OVERVALUED
PE ratios tell one story, but what if the real opportunity lies elsewhere? Discover 1442 companies where insiders are betting big on explosive growth.
Upgrade Your Decision Making: Choose your Realty Income Narrative
Earlier we mentioned that there is an even better way to understand valuation, so let us introduce you to Narratives, a simple way to connect your view of Realty Income’s business to specific numbers for its future revenue, earnings, margins, and fair value, and then compare that fair value with today’s share price to decide whether to buy, hold, or sell.
A Narrative is your story about the company, captured as an easy to follow financial forecast that ties what you believe about its tenants, growth, risks, and interest rates directly to a calculated fair value, instead of relying only on static multiples like PE or dividend yield.
On Simply Wall St’s Community page, millions of investors share these Narratives for companies like Realty Income, and each one is kept up to date automatically as new earnings, news, or guidance change the underlying numbers, so your thesis is always grounded in current information.
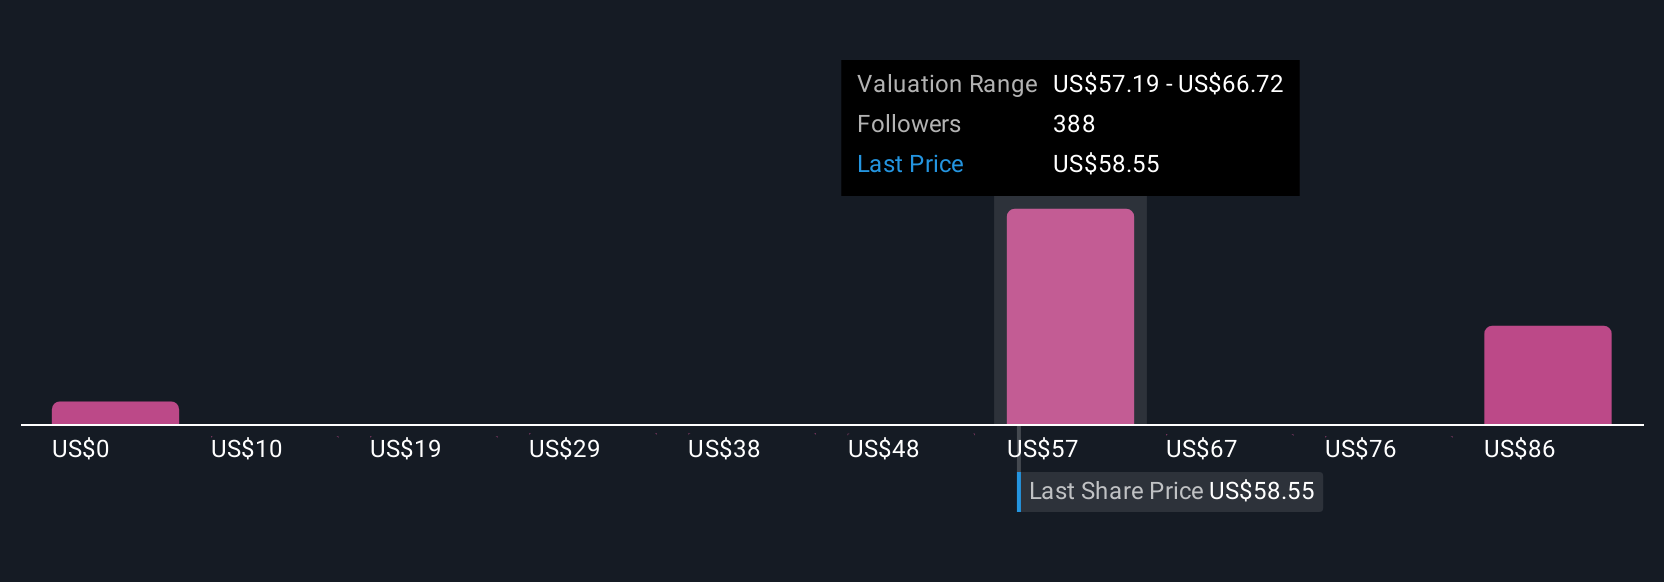
For example, one Realty Income Narrative on the platform might point to a fair value of about $61 per share based on slowing dividend growth and a more cautious return requirement, while another sees closer to $63 per share supported by stronger revenue growth and higher long term margins. This illustrates how different yet clearly defined assumptions can justify different price targets.
Do you think there's more to the story for Realty Income? Head over to our Community to see what others are saying!
This article by Simply Wall St is general in nature. We provide commentary based on historical data and analyst forecasts only using an unbiased methodology and our articles are not intended to be financial advice. It does not constitute a recommendation to buy or sell any stock, and does not take account of your objectives, or your financial situation. We aim to bring you long-term focused analysis driven by fundamental data. Note that our analysis may not factor in the latest price-sensitive company announcements or qualitative material. Simply Wall St has no position in any stocks mentioned.
Have feedback on this article? Concerned about the content? Get in touch with us directly. Alternatively, email editorial-team@simplywallst.com