
- PREMIUM
- LIVE QUOTES
- INSTITUTION
 Index Options
 State Street
 CME Group
 Nasdaq
 Cboe
Cboe TradingView
 Wall Street Journal
Is Inspire Medical Systems Stock Price Justified After Recent 64.7% Surge?
- Wondering if Inspire Medical Systems is a bargain at today’s price, or a trap that looks cheaper than it really is? Let us unpack what the recent moves and the fundamentals are actually telling us about value.
- The stock has bounced hard in the short term, up about 10% over the last week and roughly 64.7% over the last month, even though it is still down around 26.9% over the past year.
- That swing has come as investors refocus on Inspire’s role in treating obstructive sleep apnea with its implantable neurostimulation system, a niche that still has plenty of room to grow. The market has also been reacting to broader sentiment shifts toward high growth, high multiple medtech names, which can quickly change how investors price future prospects and risk.
- Despite all that excitement, Inspire Medical Systems currently scores just 0/6 on our valuation checks, suggesting it does not screen as undervalued on traditional metrics, at least at first glance. Next we will walk through those valuation approaches in detail, then finish with a more holistic way to think about what this price really implies for long term investors.
Inspire Medical Systems scores just 0/6 on our valuation checks. See what other red flags we found in the full valuation breakdown.
Approach 1: Inspire Medical Systems Discounted Cash Flow (DCF) Analysis
A Discounted Cash Flow model estimates what a business is worth by projecting the cash it can generate in the future and discounting those cash flows back to today. For Inspire Medical Systems, the model used is a 2 Stage Free Cash Flow to Equity approach based on cash flow projections.
Inspire currently generates roughly $96.3 million in free cash flow, and analyst forecasts, supplemented by Simply Wall St extrapolations, see this rising to about $155.8 million by 2026 before moderating toward roughly $53.7 million by 2035. All of these cash flows are in $ and are discounted back to arrive at an estimate of what the equity should be worth today.
On this basis, the DCF model points to an intrinsic value of about $40.96 per share. Compared with the current market price, this implies the stock is around 241.9% overvalued, which indicates investors may be paying a steep premium relative to the cash flows that can reasonably be projected.
Result: OVERVALUED
Our Discounted Cash Flow (DCF) analysis suggests Inspire Medical Systems may be overvalued by 241.9%. Discover 912 undervalued stocks or create your own screener to find better value opportunities.
Approach 2: Inspire Medical Systems Price vs Earnings
For a profitable company like Inspire Medical Systems, the price to earnings ratio is a practical way to gauge what investors are willing to pay today for each dollar of current earnings. In general, faster growing and less risky businesses deserve a higher multiple, while companies with slower growth or greater uncertainty should trade on a lower, more conservative PE ratio.
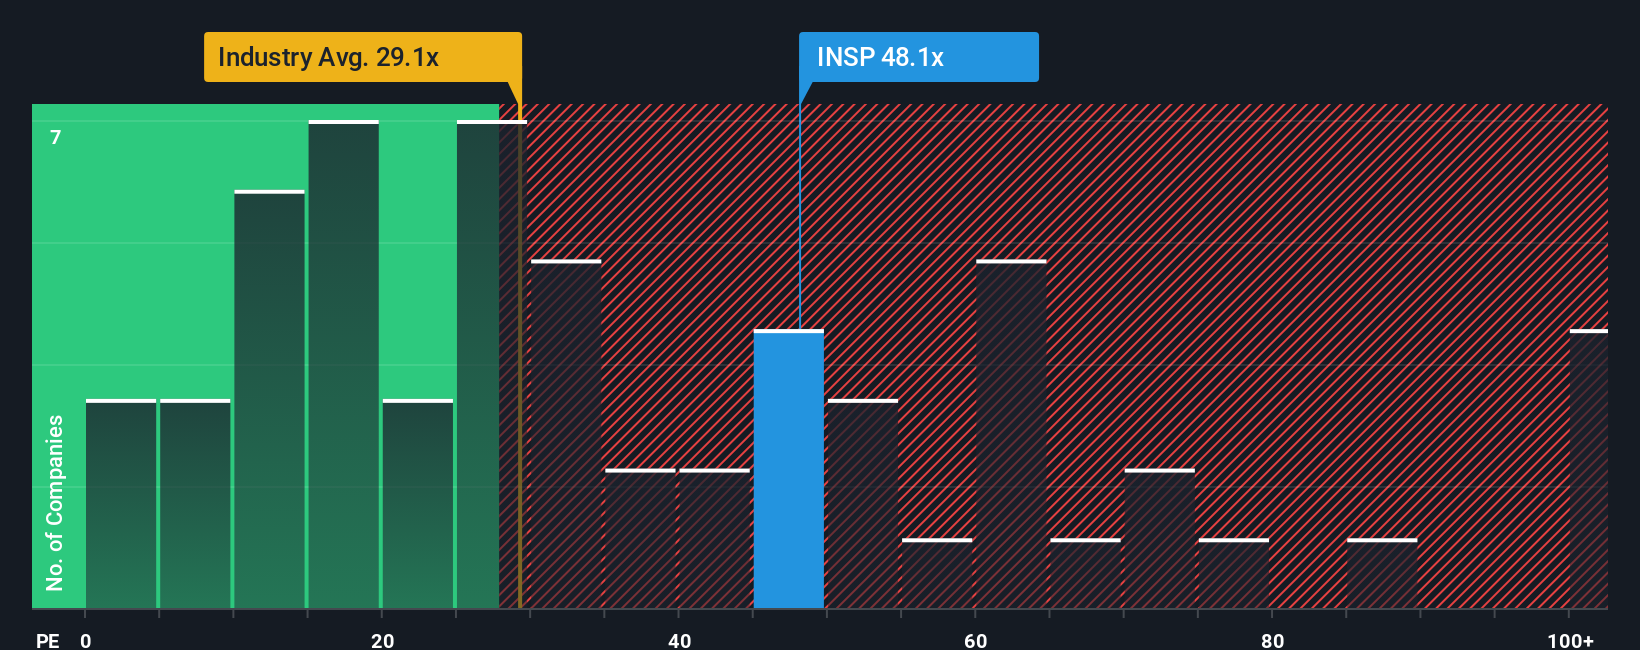
Inspire currently trades on a lofty PE of about 91.3x, far above both the broader Medical Equipment industry average of roughly 28.9x and a peer group average near 43.4x. That spread indicates that the market is factoring in very strong growth and execution. Simply Wall St’s Fair Ratio framework refines this comparison by estimating the PE that would be justified given Inspire’s specific earnings growth outlook, profitability profile, industry, size and risk factors, rather than relying only on blunt peer or sector averages.
On this basis, Inspire’s Fair Ratio is estimated at around 32.3x. With the actual PE sitting nearly three times higher than that, the shares still appear richly valued from an earnings multiple perspective, even allowing for above average growth.
Result: OVERVALUED
PE ratios tell one story, but what if the real opportunity lies elsewhere? Discover 1442 companies where insiders are betting big on explosive growth.
Upgrade Your Decision Making: Choose your Inspire Medical Systems Narrative
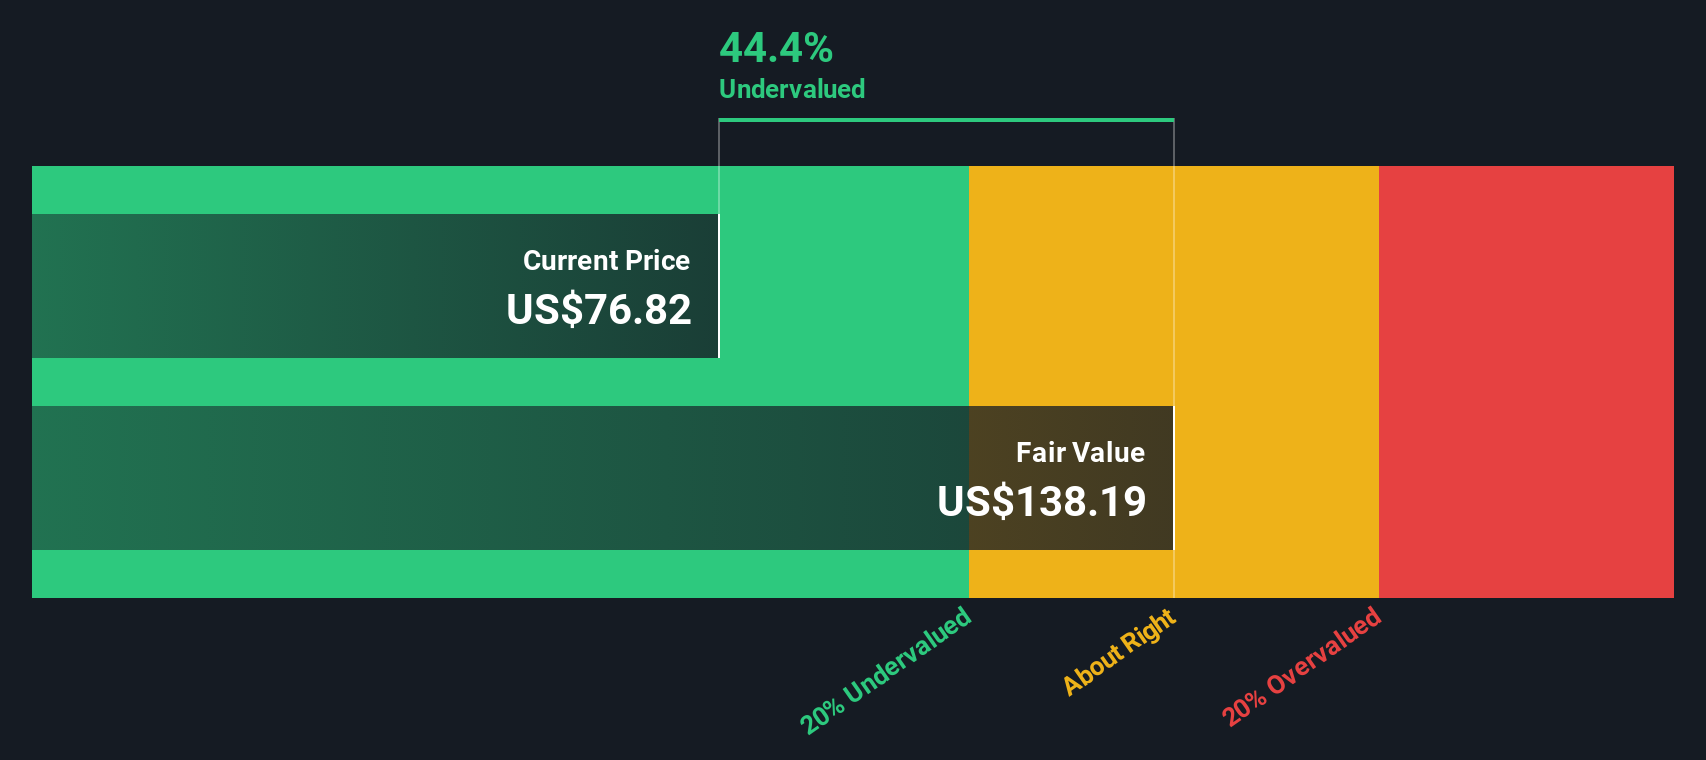
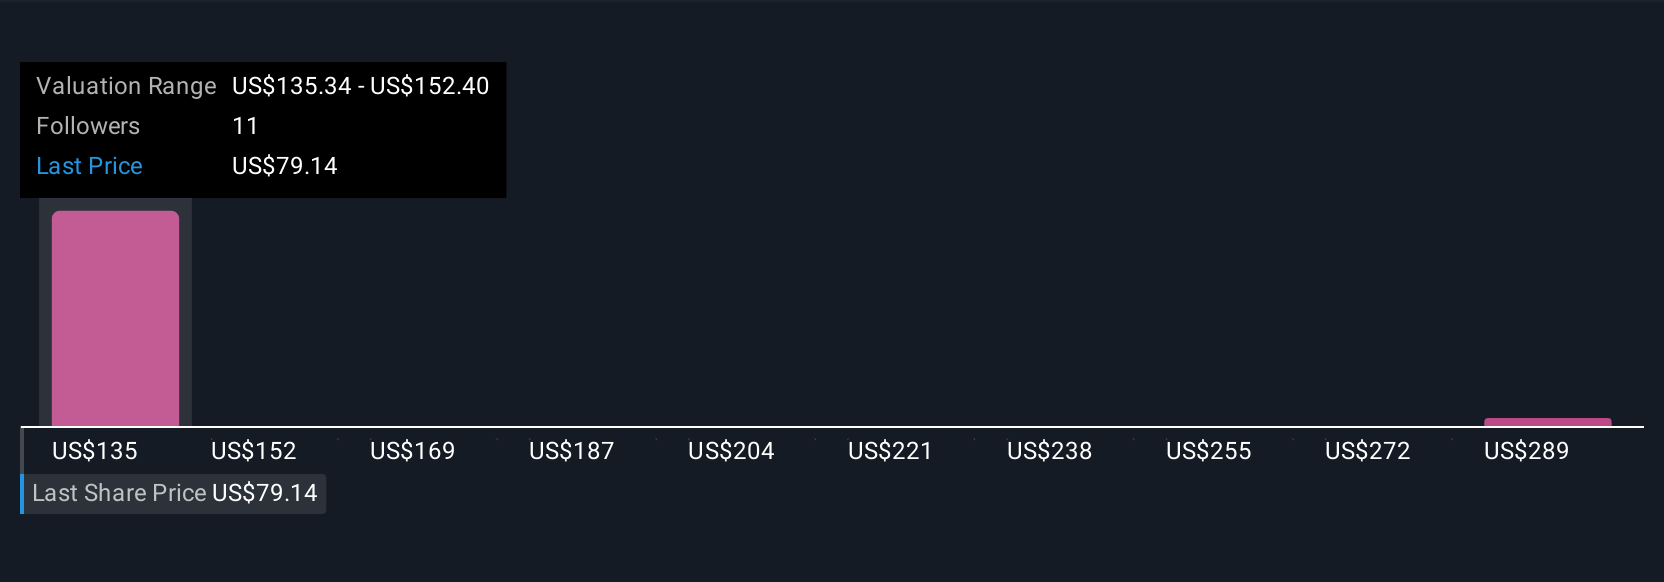
Earlier we mentioned that there is an even better way to understand valuation, so let us introduce you to Narratives, a simple way to connect your view of Inspire Medical Systems with the numbers by telling a story about its future, translating that story into revenue, earnings and margin forecasts, and then into a Fair Value that you can easily compare to today’s price. Narratives live inside the Simply Wall St Community page, where millions of investors share their perspectives, and they make it straightforward to see whether your Fair Value indicates the stock is a buy, hold or sell at the current market price. Because Narratives automatically refresh as new information arrives, such as earnings reports, clinical data or legal developments, your Fair Value view is always linked to the latest facts instead of a static spreadsheet. For Inspire Medical Systems, one investor might build a bullish Narrative around accelerating reimbursement, expanding sleep apnea demand and improving margins that supports a Fair Value near the top of current targets around $230. A more cautious investor could emphasize execution risks, competition and legal overhangs and land closer to the low end near $97. Both perspectives can be explored, compared and refined over time.
Do you think there's more to the story for Inspire Medical Systems? Head over to our Community to see what others are saying!
This article by Simply Wall St is general in nature. We provide commentary based on historical data and analyst forecasts only using an unbiased methodology and our articles are not intended to be financial advice. It does not constitute a recommendation to buy or sell any stock, and does not take account of your objectives, or your financial situation. We aim to bring you long-term focused analysis driven by fundamental data. Note that our analysis may not factor in the latest price-sensitive company announcements or qualitative material. Simply Wall St has no position in any stocks mentioned.
Have feedback on this article? Concerned about the content? Get in touch with us directly. Alternatively, email editorial-team@simplywallst.com