
- PREMIUM
- LIVE QUOTES
- INSTITUTION
 Index Options
 State Street
 CME Group
 Nasdaq
 Cboe
Cboe TradingView
 Wall Street Journal
Is BlackRock Shares Still Attractive After Strong ETF Growth And Five Year 73.6% Gain?
- If you are wondering whether BlackRock at around $1,075 a share is still a smart buy or if most of the upside is already priced in, this article will walk through that question step by step so you can judge the value for yourself.
- The stock has climbed 3.4% over the last week and 1.5% over the past month, adding to a steady 5.7% gain year to date and a 73.6% return over five years. This suggests long term holders have already enjoyed a strong ride.
- Recent headlines have focused on BlackRock expanding its footprint in exchange traded funds and sustainable investing, themes that continue to draw inflows as investors look for low cost and ESG oriented products. At the same time, the firm has remained central to conversations about institutional portfolio construction and the growing role of passive investing, which can influence how markets perceive its long term growth runway.
- Despite that backdrop, our valuation framework gives BlackRock a score of 2 out of 6, suggesting it looks undervalued on only a couple of checks. Next we will unpack what different valuation methods indicate today and, by the end, explore a more holistic way to think about whether the stock is truly priced for its future.
BlackRock scores just 2/6 on our valuation checks. See what other red flags we found in the full valuation breakdown.
Approach 1: BlackRock Excess Returns Analysis
The Excess Returns model looks at how much value BlackRock can create above the return that shareholders demand on their equity, then capitalizes those excess profits into an intrinsic value per share.
For BlackRock, the model starts with a Book Value of $357.90 per share and a Stable Book Value of $301.21 per share, based on weighted future estimates from three analysts. Using weighted future Return on Equity inputs from four analysts, the model assumes Stable EPS of $49.41 per share and an Average Return on Equity of 16.40%. Against a Cost of Equity of $25.10 per share, this implies an Excess Return of $24.32 per share, meaning BlackRock is expected to earn meaningfully more than investors require.
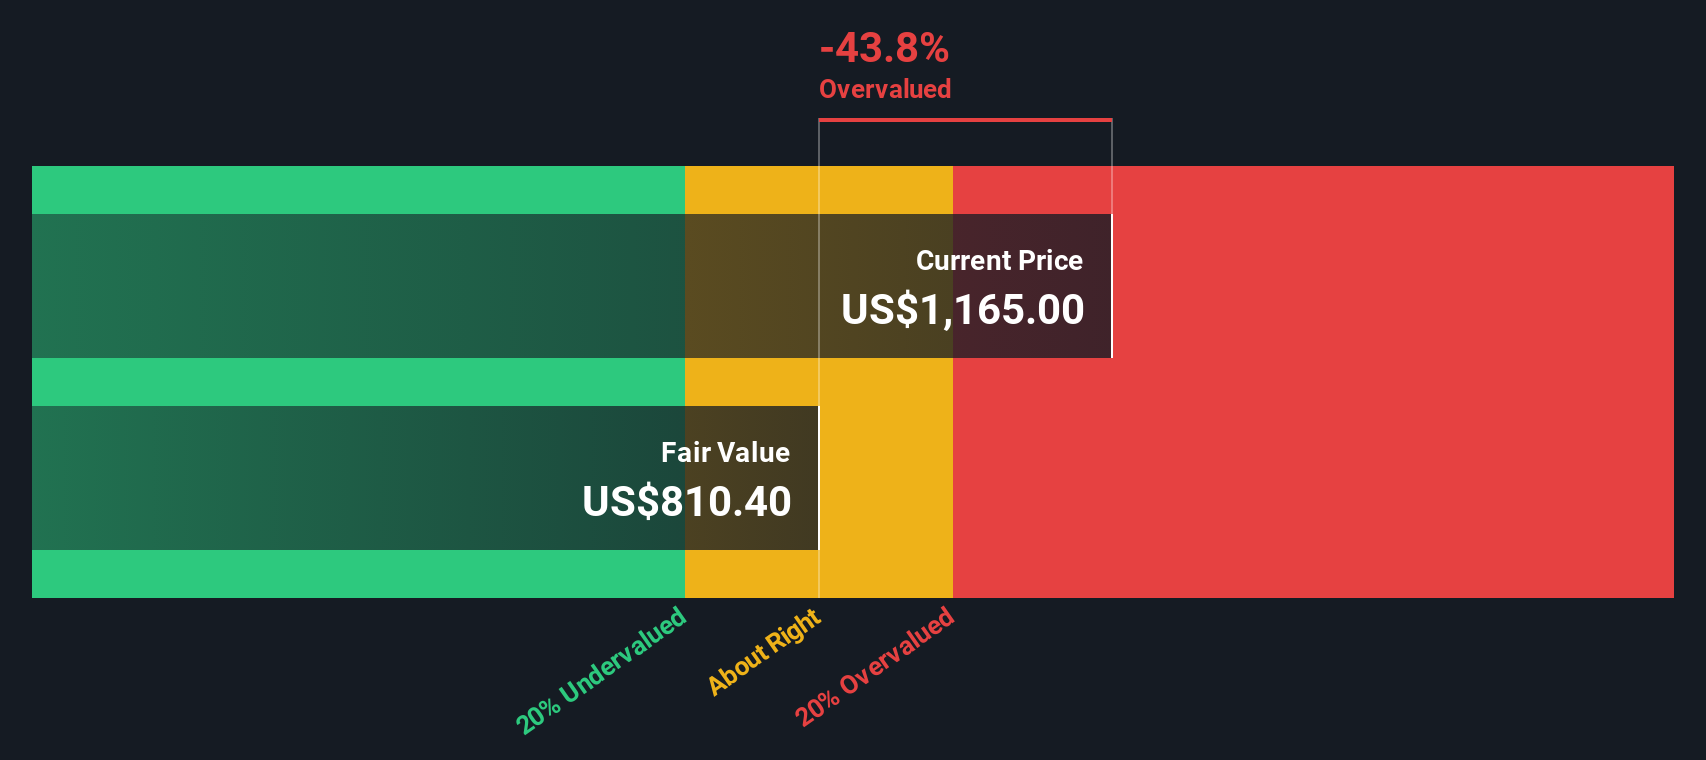
Even with those attractive excess returns, the model’s implied fair value of about $780.67 per share sits roughly 37.8% below the current share price near $1,075. This suggests the market is already pricing in a very optimistic long term growth path.
Result: OVERVALUED
Our Excess Returns analysis suggests BlackRock may be overvalued by 37.8%. Discover 912 undervalued stocks or create your own screener to find better value opportunities.
Approach 2: BlackRock Price vs Earnings
For a mature, consistently profitable asset manager like BlackRock, the price to earnings ratio is a practical way to judge valuation because it ties the share price directly to the company’s current earning power. Investors generally accept that faster, more reliable earnings growth and lower risk justify a higher multiple, while slower, volatile growth or elevated risk call for a lower, more conservative PE.
BlackRock currently trades at about 27.4x earnings. That is above the broader Capital Markets industry average of roughly 24.0x, but below the peer group average near 45.1x. This suggests the stock sits in the middle of the pack on a simple relative basis. Simply Wall St also calculates a proprietary Fair Ratio of 19.5x, which reflects what investors might reasonably pay given BlackRock’s specific growth profile, profitability, risk factors, industry positioning, and market cap.
This Fair Ratio is more informative than a straight peer or industry comparison because it adjusts for BlackRock’s own fundamentals rather than assuming all capital markets firms deserve similar multiples. With the actual PE of 27.4x sitting well above the 19.5x Fair Ratio, the multiple-based view points to the shares being priced ahead of fundamentals.
Result: OVERVALUED

PE ratios tell one story, but what if the real opportunity lies elsewhere? Discover 1442 companies where insiders are betting big on explosive growth.
Upgrade Your Decision Making: Choose your BlackRock Narrative
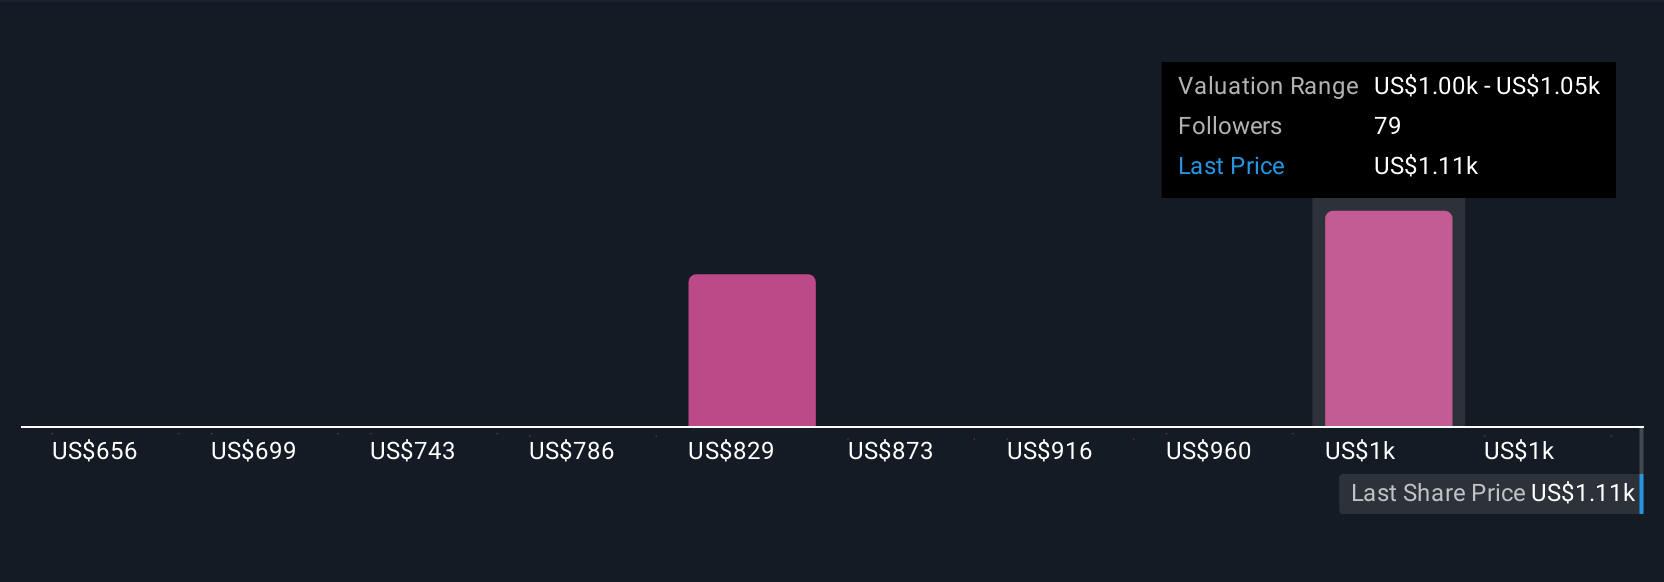
Earlier we mentioned that there is an even better way to understand valuation, so let's introduce you to Narratives, an easy tool on Simply Wall St’s Community page that lets you turn your view of BlackRock’s business into a simple story. You can connect that story to forecasts for revenue, earnings and margins, and then see a Fair Value you can compare directly with today’s price to help you decide whether to buy, hold or sell. Those Narratives update dynamically as news or earnings arrive. One investor who believes data center partnerships and private markets will drive strong growth might land on a Fair Value closer to the recent high Narrative around $1,328 per share. Another investor who is more cautious about fees, regulation and dilution might side with the lower Narrative near $1,000. This gives you a clear, visual way to see how different stories about the same company lead to different valuations.
Do you think there's more to the story for BlackRock? Head over to our Community to see what others are saying!
This article by Simply Wall St is general in nature. We provide commentary based on historical data and analyst forecasts only using an unbiased methodology and our articles are not intended to be financial advice. It does not constitute a recommendation to buy or sell any stock, and does not take account of your objectives, or your financial situation. We aim to bring you long-term focused analysis driven by fundamental data. Note that our analysis may not factor in the latest price-sensitive company announcements or qualitative material. Simply Wall St has no position in any stocks mentioned.
Have feedback on this article? Concerned about the content? Get in touch with us directly. Alternatively, email editorial-team@simplywallst.com