
- PREMIUM
- LIVE QUOTES
- INSTITUTION
 Index Options
 State Street
 CME Group
 Nasdaq
 Cboe
Cboe TradingView
 Wall Street Journal
Has ACV Auctions Recent 62% Slide Created a Compelling Valuation Opportunity in 2025?
- If you are wondering whether ACV Auctions is a beaten down bargain or a value trap, you are in the right place. We are going to unpack what the current share price is really telling us.
- The stock has slipped about 11.8% over the last month and is down roughly 62.3% year to date and 64.0% over the past year, a trajectory that has sharply reset market expectations around growth and risk.
- Investors have been reacting to a mix of factors, including shifting sentiment around online auto marketplaces and evolving expectations for how quickly ACV can scale profitably. Broader volatility in tech and growth names has also added to the pressure, even as some peers have seen renewed interest when their long term stories look compelling.
- Despite the drawdown, ACV Auctions only scores 2 out of 6 on our valuation checks, suggesting the market might still be pricing in a fair bit of optimism. We will walk through the main valuation approaches next and then finish with a more intuitive way to think about what the stock is really worth.
ACV Auctions scores just 2/6 on our valuation checks. See what other red flags we found in the full valuation breakdown.
Approach 1: ACV Auctions Discounted Cash Flow (DCF) Analysis
A Discounted Cash Flow model estimates what a business is worth by projecting its future cash flows and discounting them back to today, using a required rate of return to account for risk and time.
For ACV Auctions, the latest twelve month Free Cash Flow is about $45.2 million, and analysts expect this to grow steadily over the coming decade. By 2029, projected Free Cash Flow rises to roughly $204.1 million, with further years extrapolated by Simply Wall St to reach more than $400 million by 2035 as the platform scales and margins improve.
When all of these future cash flows are discounted back to today using a 2 Stage Free Cash Flow to Equity model, the estimated intrinsic value is about $40.56 per share. Compared with the current share price, this implies the stock is trading at roughly an 80.5% discount. This indicates the market may be significantly underestimating ACV Auctions potential for future cash generation.
Result: UNDERVALUED
Our Discounted Cash Flow (DCF) analysis suggests ACV Auctions is undervalued by 80.5%. Track this in your watchlist or portfolio, or discover 913 more undervalued stocks based on cash flows.

Approach 2: ACV Auctions Price vs Sales
For a business like ACV Auctions that is still building toward steady profitability, the Price to Sales ratio is often the cleanest way to compare valuation because it focuses on what the market is paying for each dollar of revenue rather than current earnings noise. In general, faster growth and lower perceived risk justify a higher sales multiple, while slower or more uncertain growth usually warrants a discount.
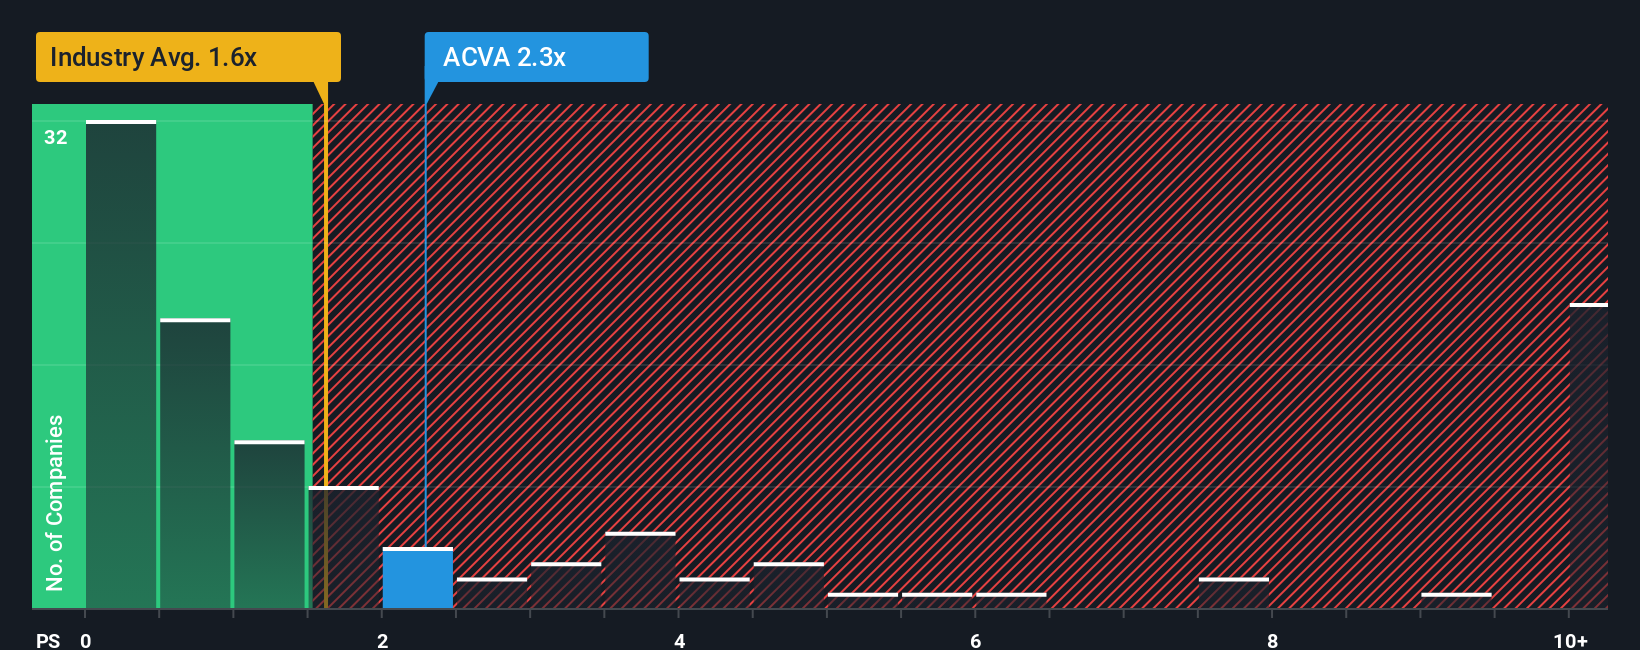
ACV Auctions currently trades on a Price to Sales ratio of about 1.85x. That is above both the Commercial Services industry average of roughly 1.11x and the peer group average of around 1.10x, suggesting the market is already assigning ACV a premium relative to many comparable names. Simply Wall St goes a step further with its proprietary Fair Ratio, which estimates what ACV Auctions sales multiple should be given its growth outlook, margins, industry, size and risk profile. This tends to be more informative than a simple peer comparison, which can miss important differences in business quality and risk.
For ACV Auctions, the Fair Ratio is 1.14x, meaning the stock appears to be valued above what its fundamentals currently justify.
Result: OVERVALUED
PS ratios tell one story, but what if the real opportunity lies elsewhere? Discover 1442 companies where insiders are betting big on explosive growth.
Upgrade Your Decision Making: Choose your ACV Auctions Narrative
Earlier we mentioned that there is an even better way to understand valuation, so let us introduce you to Narratives, a simple way to wrap a clear story around your numbers by linking your view of a company to a forecast for its revenue, earnings and margins, and then to a Fair Value estimate you can compare with today’s share price.
On Simply Wall St, Narratives live in the Community page and are used by millions of investors, because they make it easy to spell out why you believe a business like ACV Auctions will play out a certain way, turn that story into a structured financial forecast, and instantly see whether your implied Fair Value suggests the stock is a buy, hold, or sell at the current market price.
Narratives update dynamically as new information like earnings releases or major news arrives, so the Fair Value behind each view evolves in real time. For example, you can see how one investor might build a more cautious ACV Auctions Narrative that lands near the current Fair Value of about $10.38 per share, while another, more optimistic investor uses higher growth, margins and a richer future PE multiple to reach a much higher estimate.
Do you think there's more to the story for ACV Auctions? Head over to our Community to see what others are saying!

This article by Simply Wall St is general in nature. We provide commentary based on historical data and analyst forecasts only using an unbiased methodology and our articles are not intended to be financial advice. It does not constitute a recommendation to buy or sell any stock, and does not take account of your objectives, or your financial situation. We aim to bring you long-term focused analysis driven by fundamental data. Note that our analysis may not factor in the latest price-sensitive company announcements or qualitative material. Simply Wall St has no position in any stocks mentioned.
Have feedback on this article? Concerned about the content? Get in touch with us directly. Alternatively, email editorial-team@simplywallst.com