
- PREMIUM
- LIVE QUOTES
- INSTITUTION
 Index Options
 State Street
 CME Group
 Nasdaq
 Cboe
Cboe TradingView
 Wall Street Journal
Assessing Accenture’s Valuation After AI Consulting Push and Recent Share Price Rebound
- If you have been wondering whether Accenture is a bargain or a value trap at today’s price, you are not alone. This breakdown is designed to give you a clear, no jargon answer.
- After a choppy stretch, the stock has bounced roughly 8.7% over the last week and 10.9% over the past month, even though it is still down about 22.8% year to date and 23.2% over the last year. This tells us sentiment is shifting but not fully healed.
- Recently, the market has been reacting to Accenture’s big push into cloud, data and AI consulting, along with a steady stream of digital transformation contract wins, which strengthen the long term growth story. At the same time, headlines about macro uncertainty and clients tightening discretionary IT budgets have kept a lid on how far the share price is willing to run for now.
- On our numbers, Accenture scores a 4/6 valuation check, suggesting it looks undervalued on several key metrics but not a bargain across the board. Next we unpack what each valuation method is really saying and finish with a more complete way to think about what the stock is worth.
Find out why Accenture's -23.2% return over the last year is lagging behind its peers.
Approach 1: Accenture Discounted Cash Flow (DCF) Analysis
A Discounted Cash Flow model projects a company’s future cash flows and then discounts them back to today’s dollars, aiming to estimate what the business is worth right now.
For Accenture, the latest twelve month Free Cash Flow stands at roughly $10.9 billion. Analysts and internal estimates project that this could rise to about $14.8 billion by 2035, with detailed forecasts out to 2029 and then a more gradual growth path assumed by Simply Wall St after that. These cash flows are discounted using a 2 Stage Free Cash Flow to Equity framework to account for both an initial growth period and a more mature phase.
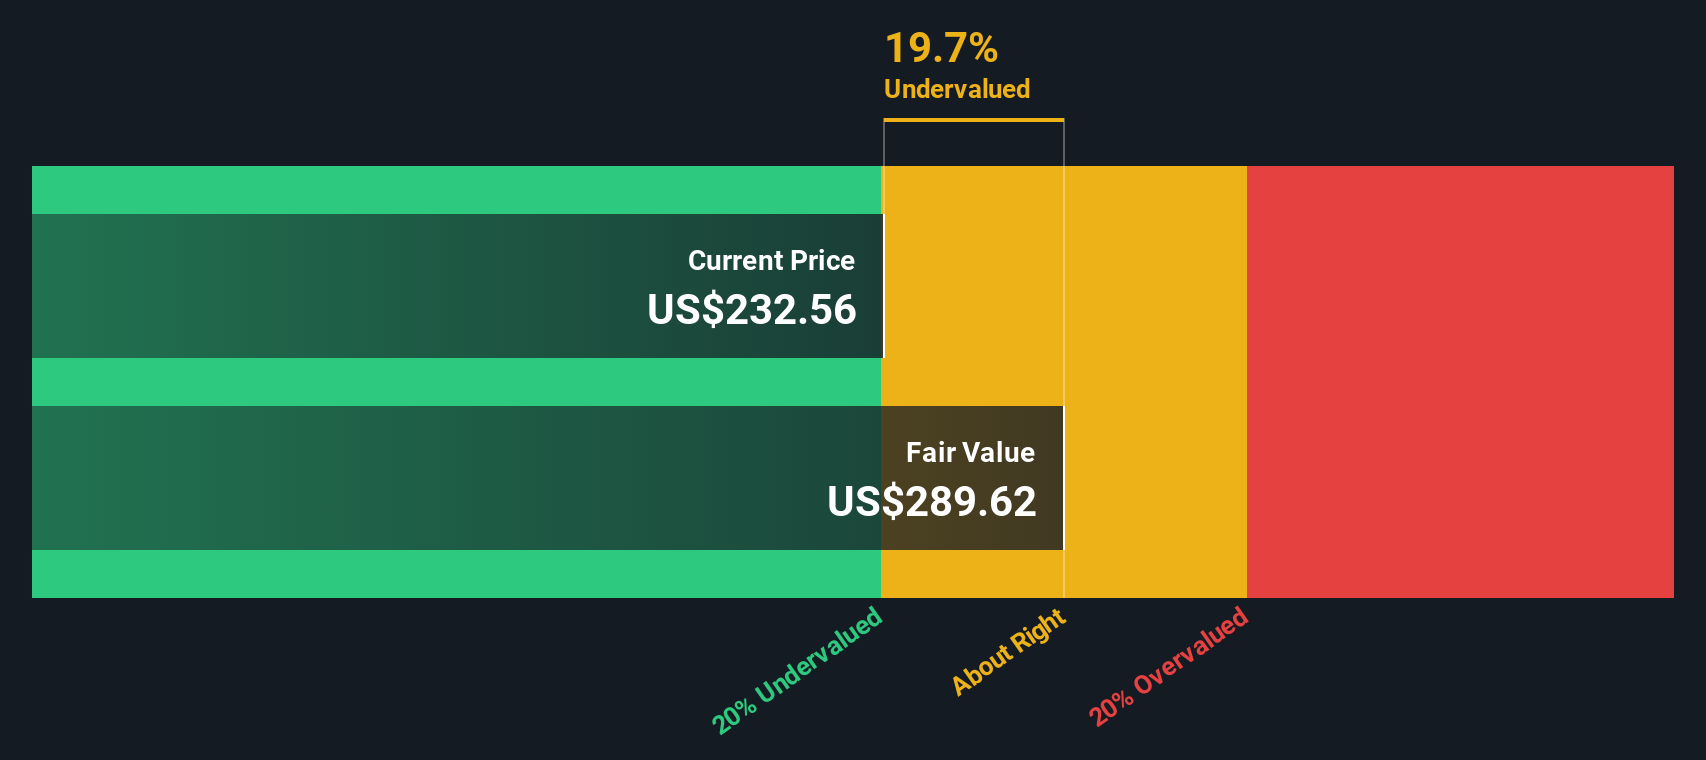
On this basis, Accenture’s intrinsic value comes out at roughly $276.26 per share, which is about 2.5% above the current market price. That implies the stock is trading very close to what the cash flow outlook suggests it is worth, with only a small margin of safety for buyers today.
Result: ABOUT RIGHT
Accenture is fairly valued according to our Discounted Cash Flow (DCF), but this can change at a moment's notice. Track the value in your watchlist or portfolio and be alerted on when to act.
Approach 2: Accenture Price vs Earnings
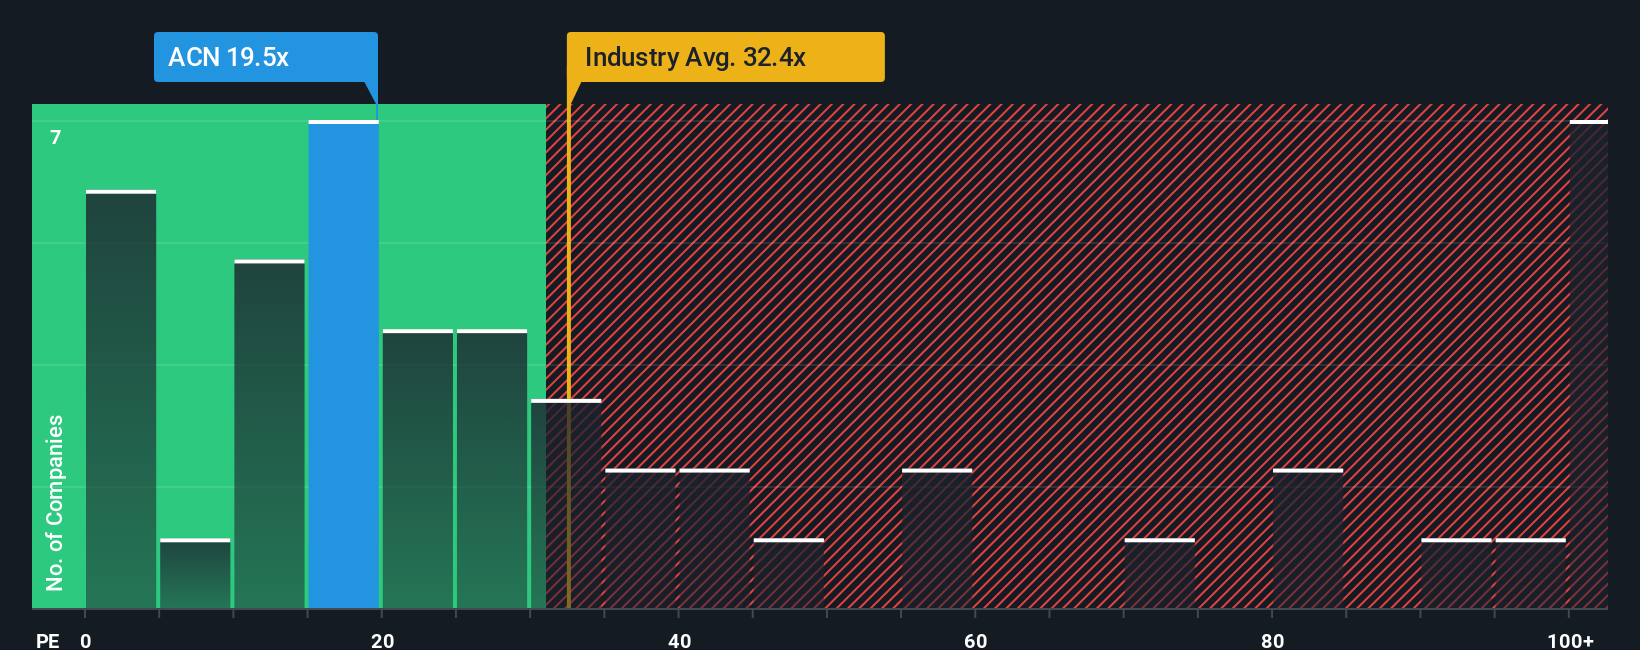
For profitable companies like Accenture, the price to earnings ratio is often the cleanest way to judge value, because it directly compares what investors pay with what the business is actually earning today.
In simple terms, higher expected growth and lower perceived risk usually justify a higher, or more generous, PE multiple, while slower growth or higher risk should pull that “normal” or “fair” multiple down. Accenture currently trades on a PE of about 21.75x, which is below both the IT industry average of roughly 29.95x and the peer group average of around 25.35x, suggesting the market is applying a discount despite Accenture’s quality and scale.
Simply Wall St’s Fair Ratio of 36.72x is a proprietary estimate of what PE the company deserves given its earnings growth outlook, profit margins, size, industry positioning and risk profile. This makes it more tailored than a simple peer or sector comparison, which can be skewed by outliers or very different business models. With the Fair Ratio well above the current 21.75x, the multiple based view points to Accenture being meaningfully undervalued at today’s price.
Result: UNDERVALUED
PE ratios tell one story, but what if the real opportunity lies elsewhere? Discover 1442 companies where insiders are betting big on explosive growth.
Upgrade Your Decision Making: Choose your Accenture Narrative
Earlier we mentioned that there is an even better way to understand valuation, so let us introduce you to Narratives.
A Narrative is simply your story about a company turned into numbers, where you spell out what you think will happen to its revenue, earnings and margins, and the fair value those assumptions lead to.
Instead of looking at a PE or DCF in isolation, a Narrative links Accenture’s business story, a concrete financial forecast and a resulting fair value, so you can clearly see why you think the stock is cheap or expensive.
On Simply Wall St, Narratives sit in the Community page and are used by millions of investors, making them an easy, accessible way to track your thesis and compare it with others.
They help you monitor your decisions by constantly comparing each Narrative’s Fair Value with the live share price, and they automatically update when new information like earnings, news or guidance is released.
For example, one Accenture Narrative might see fair value around $202 because it assumes slower growth and tighter margins. Another might land closer to $277 on the view that Gen AI adoption and margin resilience support faster growth and a higher future PE multiple.
For Accenture however we will make it really easy for you with previews of two leading Accenture Narratives:
Fair value: $277.08 per share
Implied undervaluation: approximately 2.8%
Forecast revenue growth: 5.65%
- Assumes Gen AI driven transformations, strategic acquisitions and strong cloud and security demand sustain mid single digit revenue growth and modest margin expansion.
- Builds in rising EPS to about $16.15 by 2028, helped by buybacks and a future PE multiple that stays below the current US IT industry average.
- Sees fair value above the current price, but flags risks from federal revenue softness, FX headwinds, margin pressures and a competitive pricing environment.
Fair value: $202.38 per share
Implied overvaluation: approximately 33.1%
Forecast revenue growth: 5.44%
- Notes that after a sector de rating, Accenture trades near long run average multiples even though bookings have softened and growth is more selective.
- Highlights solid profitability, free cash flow, dividends and buybacks, but argues that muted IT services spending and slower bookings could cap upside.
- Views the stock as overvalued versus its fair value, with key risks around bookings cadence, consulting cyclicality and FX or mix pressures on margins.
Do you think there's more to the story for Accenture? Head over to our Community to see what others are saying!

This article by Simply Wall St is general in nature. We provide commentary based on historical data and analyst forecasts only using an unbiased methodology and our articles are not intended to be financial advice. It does not constitute a recommendation to buy or sell any stock, and does not take account of your objectives, or your financial situation. We aim to bring you long-term focused analysis driven by fundamental data. Note that our analysis may not factor in the latest price-sensitive company announcements or qualitative material. Simply Wall St has no position in any stocks mentioned.
Have feedback on this article? Concerned about the content? Get in touch with us directly. Alternatively, email editorial-team@simplywallst.com