
- PREMIUM
- LIVE QUOTES
- INSTITUTION
 Index Options
 State Street
 CME Group
 Nasdaq
 Cboe
Cboe TradingView
 Wall Street Journal
Assessing Calix After a 58% 2025 Surge and DCF Implied Upside
- Wondering if Calix at around $53.65 is still a smart buy after its big run, or if the easy money has already been made? This breakdown is designed to give you a clear, valuation focused view.
- Despite short term volatility with the stock down 3.9% over the last week and 18.0% over the last month, Calix is still up 58.3% year to date and 63.7% over the last year, while delivering a 115.5% gain over five years.
- Recent moves have been shaped by ongoing enthusiasm around Calix's role in broadband and cloud platform deployments, especially as service providers invest to upgrade networks and customer experience tools. At the same time, shifting expectations for telecom capex and higher rate driven risk perceptions have added a layer of caution that shows up in the share price swings.
- On our valuation checks, Calix scores a 4 out of 6. This suggests it looks undervalued on several fronts but not all. Next we will unpack what that means across different valuation approaches, before finishing with a more holistic way to think about its true worth.
Approach 1: Calix Discounted Cash Flow (DCF) Analysis
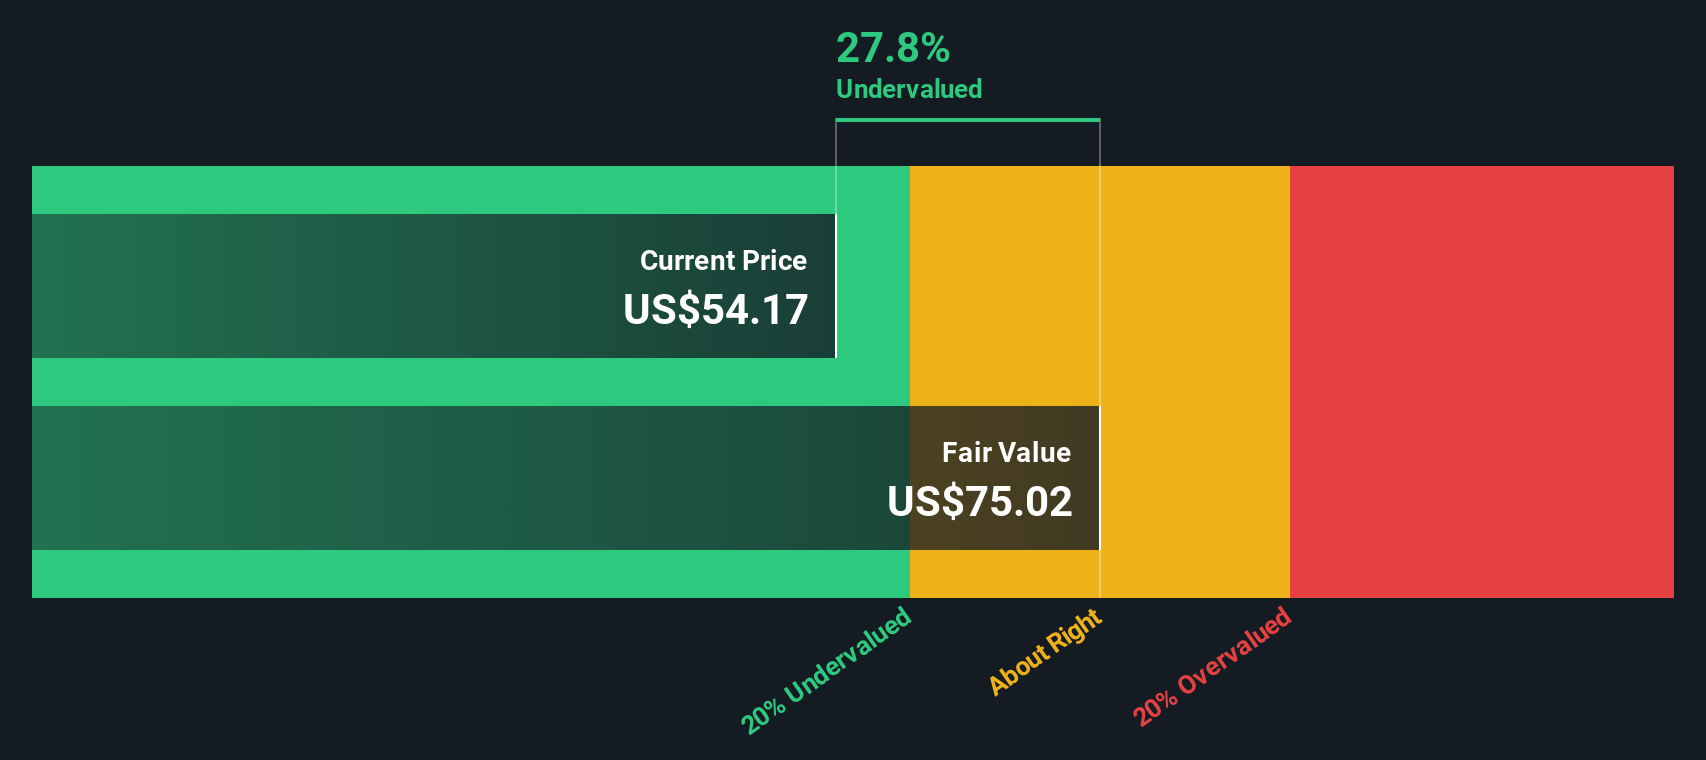
The Discounted Cash Flow model estimates what a business is worth by projecting the cash it can generate in the future and then discounting those cash flows back to today in $ terms. For Calix, the latest twelve month free cash flow is about $86.4 Million, and analysts plus Simply Wall St projections see this rising steadily over the next decade, with free cash flow expected to reach roughly $331.3 Million by 2035 as the company scales its broadband and cloud platforms.
Using a 2 Stage Free Cash Flow to Equity model, these yearly cash flows are projected and discounted to arrive at an intrinsic value of about $75.32 per share. Compared with the current share price around $53.65, the DCF implies the stock is roughly 28.8% undervalued, which indicates the market may not be fully pricing in Calix's future cash generation potential.
Result: UNDERVALUED
Our Discounted Cash Flow (DCF) analysis suggests Calix is undervalued by 28.8%. Track this in your watchlist or portfolio, or discover 913 more undervalued stocks based on cash flows.
Approach 2: Calix Price vs Sales
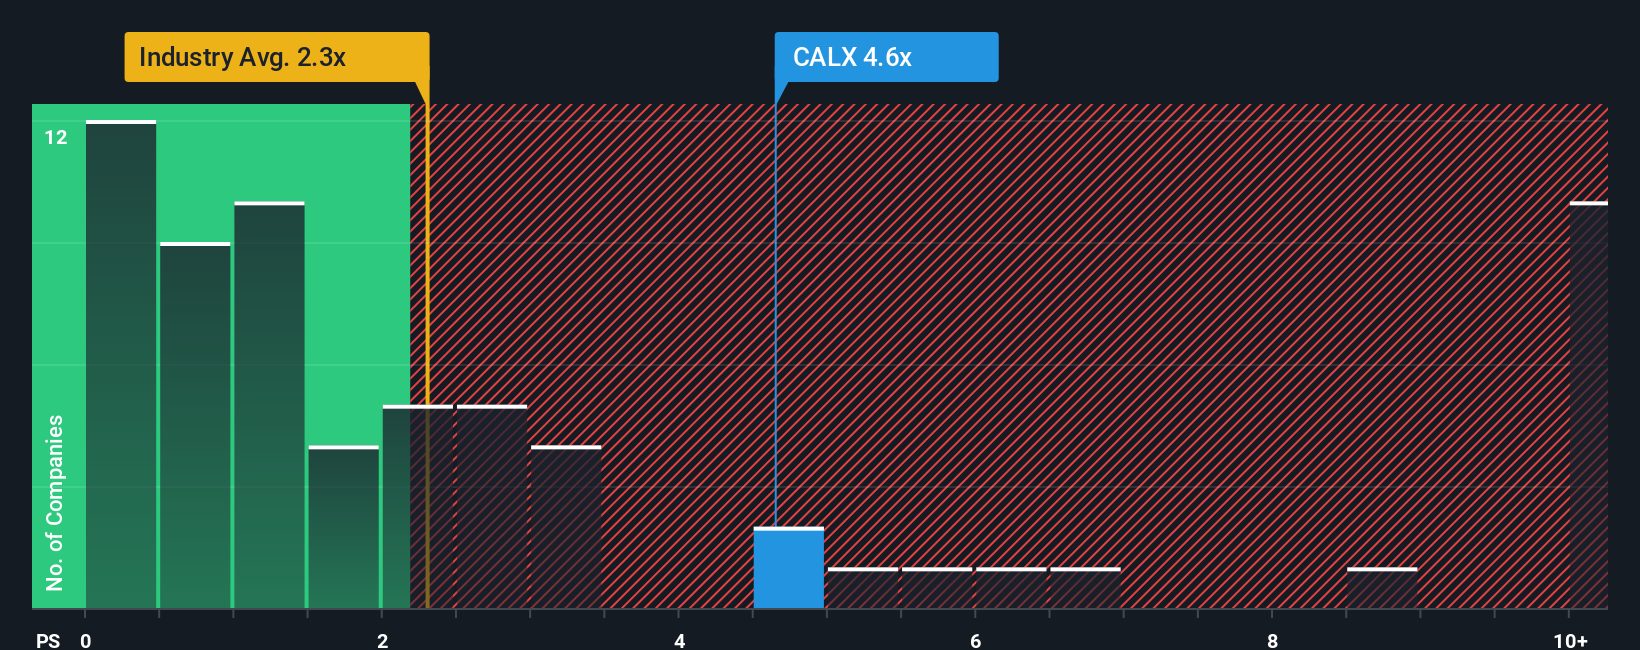
For a business like Calix that is still reinvesting heavily, the price to sales multiple is a useful way to compare what investors are paying for each dollar of revenue, even when earnings are not yet a steady guide. The “right” level for this multiple usually rises with stronger growth prospects and falls when risks or uncertainty are higher, so context matters.
Calix currently trades on about 3.81x sales, which is notably above the Communications industry average of roughly 1.95x and also ahead of the peer group average near 2.11x. Simply Wall St’s Fair Ratio for Calix, at around 4.33x sales, estimates what investors might be willing to pay given its specific mix of growth potential, margins, industry position, market cap and risk profile. This tailored measure can be more informative than a simple peer or industry comparison because it adjusts for the company’s own fundamentals rather than assuming all firms deserve similar valuations.
With the Fair Ratio of 4.33x sitting above the current 3.81x price to sales, this framework indicates that Calix is trading at a discount relative to what its fundamentals might support.
Result: UNDERVALUED
PS ratios tell one story, but what if the real opportunity lies elsewhere? Discover 1442 companies where insiders are betting big on explosive growth.
Upgrade Your Decision Making: Choose your Calix Narrative
Earlier we mentioned that there is an even better way to understand valuation, so let us introduce you to Narratives, a simple way to attach your own story about Calix to the numbers like fair value, future revenue, earnings and margins, and see how that story translates into a forecast and then into a clear estimate of what the stock is really worth.
On Simply Wall St, Narratives live inside the Community page and are used by millions of investors as an easy, visual tool to compare their Fair Value with today’s share price, so they can quickly decide how Calix looks as a buy, hold or sell candidate based on their own assumptions rather than just the market mood.
Because Narratives are dynamic, they automatically update when new information arrives, such as earnings results or major product news. This means your fair value for Calix can shift in real time as the story and the financial outlook evolve.
For example, one Calix Narrative might assume strong adoption of its AI driven third generation platform and assign a fair value closer to the higher analyst targets. A more cautious Narrative might instead focus on competitive and regulatory risks and land on a materially lower fair value, giving two very different but clearly explained perspectives on the same stock.
Do you think there's more to the story for Calix? Head over to our Community to see what others are saying!

This article by Simply Wall St is general in nature. We provide commentary based on historical data and analyst forecasts only using an unbiased methodology and our articles are not intended to be financial advice. It does not constitute a recommendation to buy or sell any stock, and does not take account of your objectives, or your financial situation. We aim to bring you long-term focused analysis driven by fundamental data. Note that our analysis may not factor in the latest price-sensitive company announcements or qualitative material. Simply Wall St has no position in any stocks mentioned.
Have feedback on this article? Concerned about the content? Get in touch with us directly. Alternatively, email editorial-team@simplywallst.com