
- PREMIUM
- LIVE QUOTES
- INSTITUTION
 Index Options
 State Street
 CME Group
 Nasdaq
 Cboe
Cboe TradingView
 Wall Street Journal
How Netflix’s Ad Push and Password Crackdown Shape Its 2025 Valuation Outlook
- Wondering if Netflix is still worth buying after its huge run over the last few years, or if most of the upside is already priced in?
- Despite pulling back around 4.1% over the last week and 6.0% over the past month, the stock is still up 16.4% year to date and about 222.6% over three years, which says a lot about how the market views its long term story.
- Recently, investors have been focused on Netflix's push into ad supported tiers and its crackdown on password sharing, both of which aim to unlock new revenue without massive content cost increases. There has also been growing attention on Netflix's experiments with games and live programming, which could diversify its growth drivers beyond the traditional streaming model.
- On our framework of 6 valuation checks, Netflix currently scores a 2 out of 6. This suggests the market may be paying up for its growth. In the next sections we will walk through different valuation approaches to see if that premium is justified and hint at an even more insightful way to think about Netflix's true worth by the end of the article.
Netflix scores just 2/6 on our valuation checks. See what other red flags we found in the full valuation breakdown.
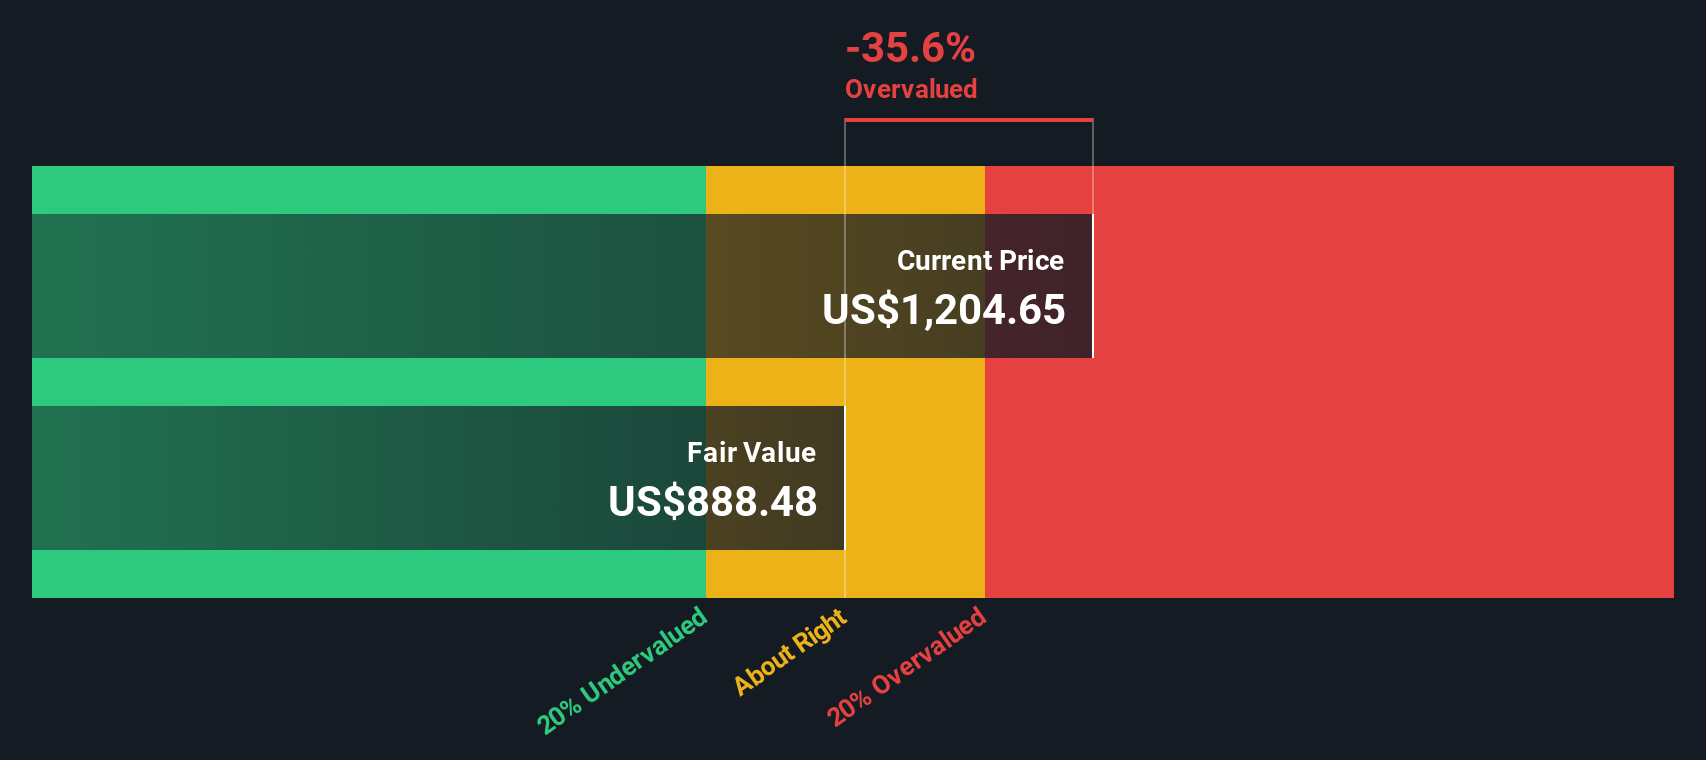
Approach 1: Netflix Discounted Cash Flow (DCF) Analysis
The Discounted Cash Flow model estimates what a business is worth by projecting its future cash flows and discounting them back to today, adjusting for risk and the time value of money. For Netflix, the latest twelve month Free Cash Flow is about $9.1 billion, and analysts expect this to keep growing strongly over the coming decade, reaching around $30.9 billion by 2035. The early years of this path are informed by analyst estimates, while the later years are extrapolated by Simply Wall St using a 2 Stage Free Cash Flow to Equity approach.
Aggregating and discounting these cash flows gives an estimated intrinsic value of about $86.62 per share. Compared with the current market price, the DCF suggests Netflix is roughly 19.2% overvalued, which means investors may be paying a premium for its growth profile that is not fully supported by cash flow projections alone.
Result: OVERVALUED
Our Discounted Cash Flow (DCF) analysis suggests Netflix may be overvalued by 19.2%. Discover 913 undervalued stocks or create your own screener to find better value opportunities.
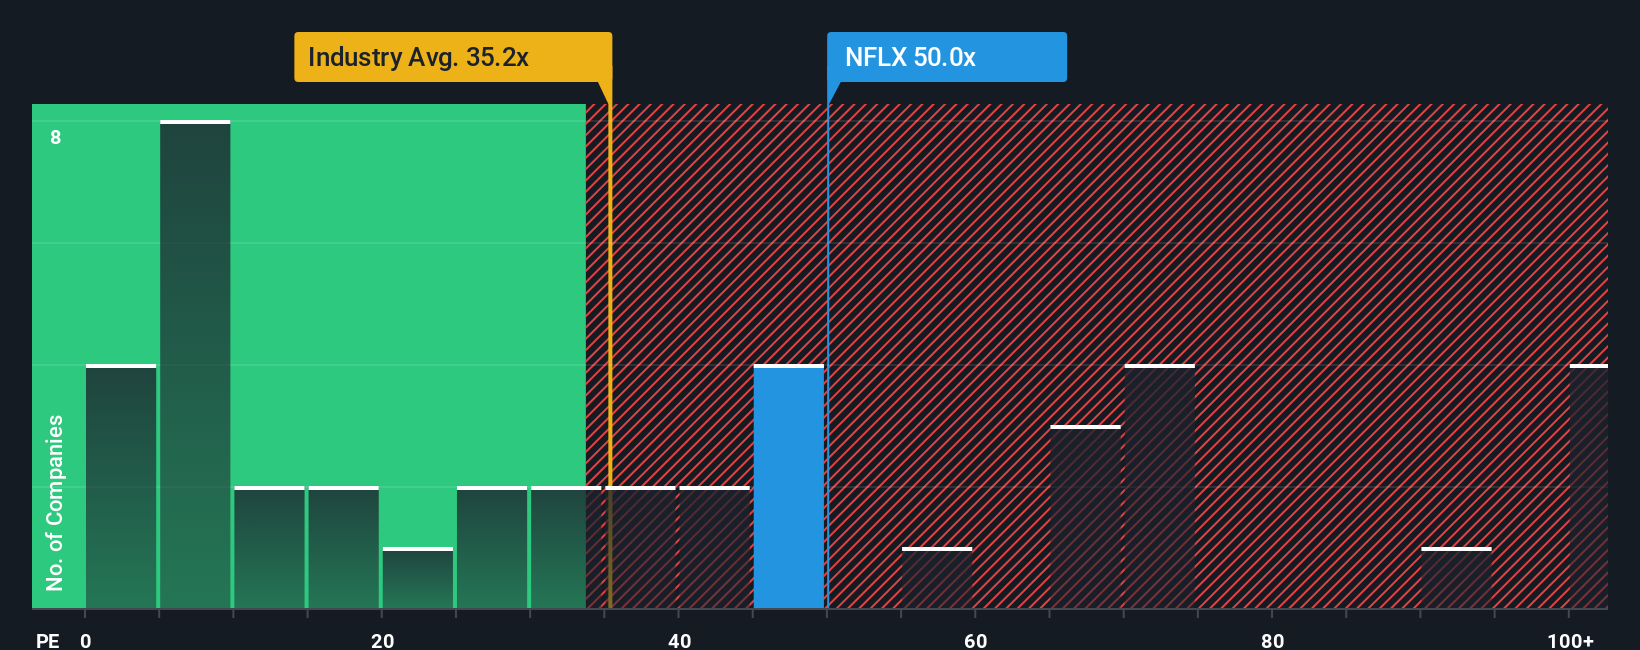
Approach 2: Netflix Price vs Earnings
For a profitable business like Netflix, the price to earnings (PE) ratio is a useful way to gauge how much investors are willing to pay for each dollar of current earnings. A higher PE can be justified when the market expects faster growth or sees the company as less risky. In contrast, slower growth or higher uncertainty typically calls for a lower, more conservative multiple.
Netflix currently trades on a PE of about 41.9x, which is well above the broader Entertainment industry average of roughly 23.2x and still below the peer group average of around 77.7x. To move beyond these broad comparisons, Simply Wall St uses a proprietary Fair Ratio, which estimates what PE multiple would be reasonable given Netflix’s specific earnings growth outlook, profitability, industry, market cap and risk profile.
Because the Fair Ratio of 33.3x explicitly incorporates these company specific drivers, it is a more tailored benchmark than simply comparing Netflix to its sector or peers. With the market paying 41.9x compared with a Fair Ratio of 33.3x, the stock appears to be trading at a meaningful premium to what its fundamentals alone would typically support.
Result: OVERVALUED
PE ratios tell one story, but what if the real opportunity lies elsewhere? Discover 1442 companies where insiders are betting big on explosive growth.
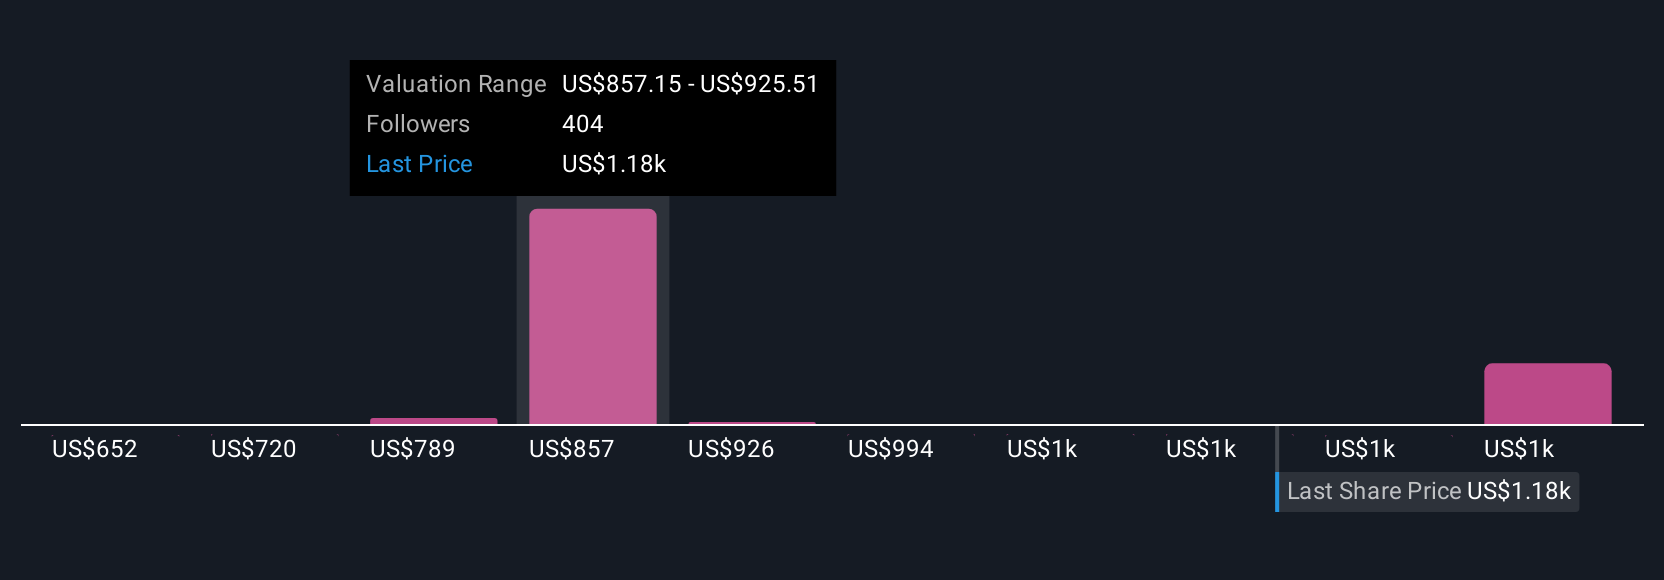
Upgrade Your Decision Making: Choose your Netflix Narrative
Earlier we mentioned that there is an even better way to understand valuation, so let us introduce you to Narratives. This is a simple framework on Simply Wall St’s Community page where you connect your view of a company’s story with a concrete forecast for its revenue, earnings and margins. You can then translate that into your own Fair Value to compare against today’s price when deciding whether to buy or sell. Your Narrative automatically updates as fresh news, earnings and guidance come in, so your thesis stays current rather than static. This is why different investors looking at Netflix can reasonably arrive at very different conclusions. For example, one bullish Narrative might assume ad tech, live sports deals and international expansion support a higher long term margin and a fair value closer to the upper analyst target band around $160. A more cautious Narrative focuses on mounting competition, rising content spend and regulatory risks and instead anchors on a fair value nearer the low end of recent analyst targets around $75, showing how the same set of facts can support distinct, yet logically structured, investment stories.
Do you think there's more to the story for Netflix? Head over to our Community to see what others are saying!
This article by Simply Wall St is general in nature. We provide commentary based on historical data and analyst forecasts only using an unbiased methodology and our articles are not intended to be financial advice. It does not constitute a recommendation to buy or sell any stock, and does not take account of your objectives, or your financial situation. We aim to bring you long-term focused analysis driven by fundamental data. Note that our analysis may not factor in the latest price-sensitive company announcements or qualitative material. Simply Wall St has no position in any stocks mentioned.
Have feedback on this article? Concerned about the content? Get in touch with us directly. Alternatively, email editorial-team@simplywallst.com