
- PREMIUM
- LIVE QUOTES
- INSTITUTION
 Index Options
 State Street
 CME Group
 Nasdaq
 Cboe
Cboe TradingView
 Wall Street Journal
Commerce.com Leads The Charge With These 3 Penny Stocks
As the U.S. markets close with mixed results and investors await key inflation data, the focus remains on how economic indicators will influence Federal Reserve policies. In this context, penny stocks continue to attract attention for their potential to offer unique investment opportunities in smaller or emerging companies. Despite being an old term, penny stocks highlight firms that may provide value and growth prospects when backed by solid financials. We've identified three such stocks that stand out for their financial strength and potential upside, offering a glimpse into promising under-the-radar investments.
Top 10 Penny Stocks In The United States
| Name | Share Price | Market Cap | Rewards & Risks |
| Dingdong (Cayman) (DDL) | $1.95 | $392.18M | ✅ 4 ⚠️ 0 View Analysis > |
| Waterdrop (WDH) | $1.82 | $683.54M | ✅ 4 ⚠️ 0 View Analysis > |
| WM Technology (MAPS) | $0.9086 | $155.08M | ✅ 4 ⚠️ 2 View Analysis > |
| LexinFintech Holdings (LX) | $3.24 | $545.17M | ✅ 4 ⚠️ 2 View Analysis > |
| Tuya (TUYA) | $2.375 | $1.43B | ✅ 4 ⚠️ 1 View Analysis > |
| CI&T (CINT) | $4.86 | $621.82M | ✅ 5 ⚠️ 0 View Analysis > |
| Golden Growers Cooperative (GGRO.U) | $5.00 | $77.45M | ✅ 1 ⚠️ 5 View Analysis > |
| VAALCO Energy (EGY) | $3.56 | $376.37M | ✅ 2 ⚠️ 3 View Analysis > |
| BAB (BABB) | $0.8699 | $6.08M | ✅ 2 ⚠️ 3 View Analysis > |
| Lifetime Brands (LCUT) | $4.30 | $96.74M | ✅ 3 ⚠️ 2 View Analysis > |
Click here to see the full list of 342 stocks from our US Penny Stocks screener.
Here's a peek at a few of the choices from the screener.
Commerce.com (CMRC)
Simply Wall St Financial Health Rating: ★★★★★☆
Overview: Commerce.com, Inc. provides a software-as-a-service e-commerce platform for brands and retailers across multiple regions globally, with a market cap of $381.94 million.
Operations: Commerce.com generates revenue of $339.86 million from its Internet Information Providers segment.
Market Cap: $381.94M
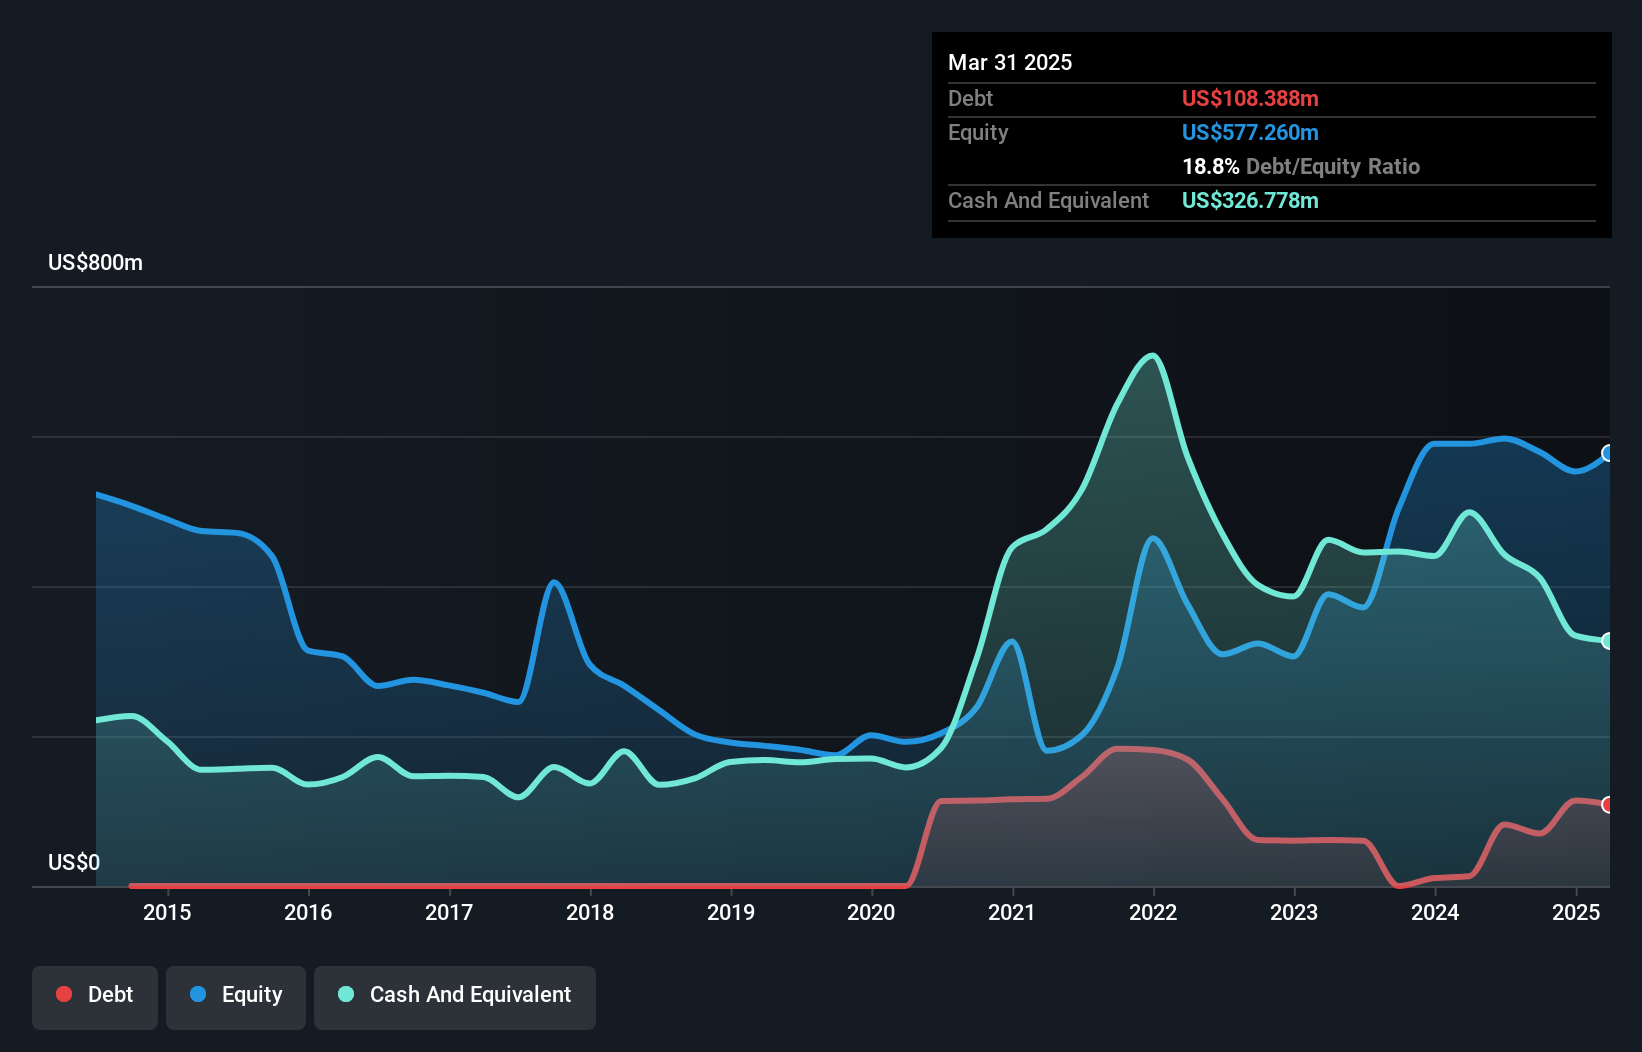
Commerce.com, Inc. is navigating the penny stock landscape with a market cap of US$381.94 million and recent revenue growth in its Internet Information Providers segment. Despite being unprofitable, the company has reduced its losses over the past five years by 12.5% annually and maintains a positive cash flow with a runway exceeding three years. Recent initiatives include launching new Shopify merchant capabilities and expanding AI-driven commerce features through partnerships with PayPal, enhancing operational efficiency for merchants. Although facing high debt levels, Commerce.com’s short-term assets cover liabilities effectively, positioning it for potential strategic growth in e-commerce solutions.
- Get an in-depth perspective on Commerce.com's performance by reading our balance sheet health report here.
- Assess Commerce.com's future earnings estimates with our detailed growth reports.

Acacia Research (ACTG)
Simply Wall St Financial Health Rating: ★★★★★★
Overview: Acacia Research Corporation is an acquirer and operator of businesses in the industrial, energy, and technology sectors across various global regions, with a market cap of approximately $369.44 million.
Operations: The company's revenue is primarily derived from its Energy Operations ($65.14 million), Industrial Operations ($29.16 million), and Intellectual Property Operations ($78.11 million).
Market Cap: $369.44M
Acacia Research Corporation's financial positioning in the penny stock sector is marked by its robust cash reserves of approximately US$332 million, supporting potential M&A activities. Despite a low Return on Equity at 1% and recent negative earnings growth, the company has improved its debt profile significantly over five years. The third quarter of 2025 showed a substantial revenue increase to US$59.45 million from US$23.31 million year-on-year, although profit margins have declined sharply from last year’s levels. Acacia's management team is experienced with an average tenure of 3.8 years, focusing on strategic growth opportunities across diverse sectors.
- Navigate through the intricacies of Acacia Research with our comprehensive balance sheet health report here.
- Understand Acacia Research's earnings outlook by examining our growth report.
Kaltura (KLTR)
Simply Wall St Financial Health Rating: ★★★★★★
Overview: Kaltura, Inc. offers a range of software-as-a-service and platform-as-a-service solutions globally, with a market cap of approximately $248.57 million.
Operations: The company generates revenue through two primary segments: Media & Telecom, contributing $47.94 million, and Enterprise, Education and Technology, which accounts for $132.98 million.
Market Cap: $248.57M
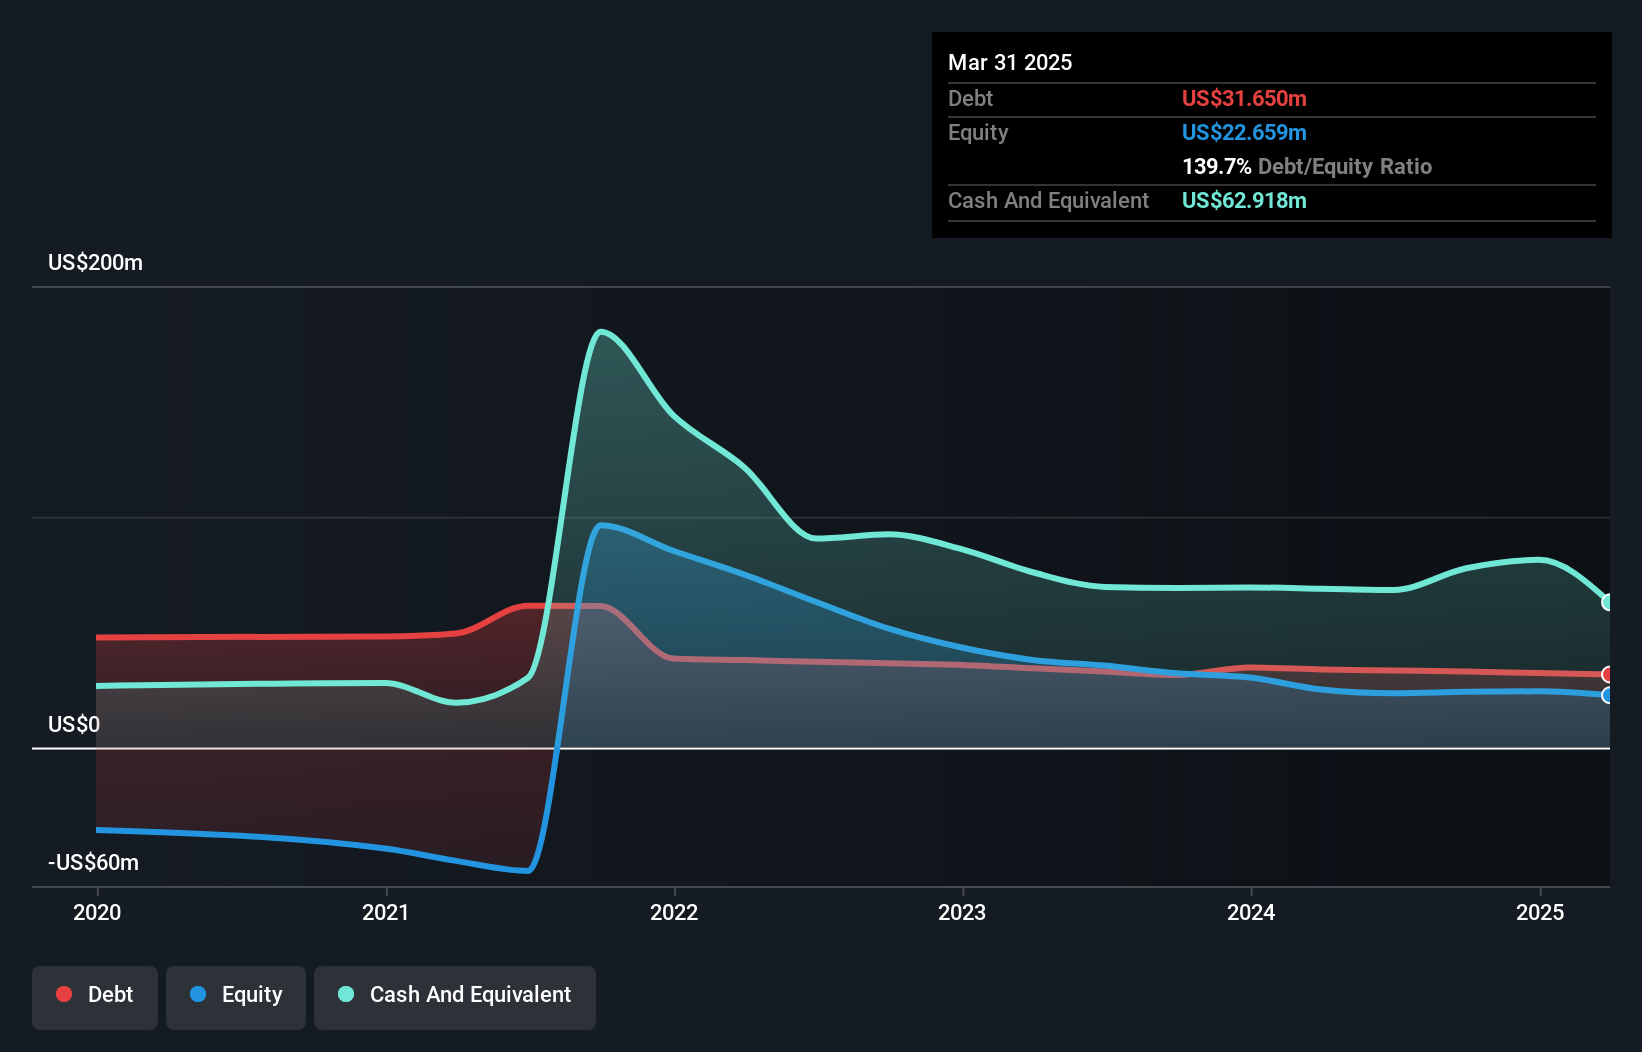
Kaltura, Inc. is navigating the penny stock landscape with a market cap of US$248.57 million and a diverse revenue base across Media & Telecom and Enterprise segments. Despite being unprofitable, it has shown progress by reducing losses over five years at 25.1% annually and maintaining a stable cash runway for over three years due to positive free cash flow growth of 25.9%. The company recently projected its full-year revenue to be between US$180.3 million and US$181 million, reflecting steady performance amidst executive changes and product innovations like the new Media Publishing Agent aimed at enhancing monetization strategies.
- Click here to discover the nuances of Kaltura with our detailed analytical financial health report.
- Examine Kaltura's earnings growth report to understand how analysts expect it to perform.
Taking Advantage
- Click this link to deep-dive into the 342 companies within our US Penny Stocks screener.
- Ready For A Different Approach? The best AI stocks today may lie beyond giants like Nvidia and Microsoft. Find the next big opportunity with these 26 smaller AI-focused companies with strong growth potential through early-stage innovation in machine learning, automation, and data intelligence that could fund your retirement.
This article by Simply Wall St is general in nature. We provide commentary based on historical data and analyst forecasts only using an unbiased methodology and our articles are not intended to be financial advice. It does not constitute a recommendation to buy or sell any stock, and does not take account of your objectives, or your financial situation. We aim to bring you long-term focused analysis driven by fundamental data. Note that our analysis may not factor in the latest price-sensitive company announcements or qualitative material. Simply Wall St has no position in any stocks mentioned.
Have feedback on this article? Concerned about the content? Get in touch with us directly. Alternatively, email editorial-team@simplywallst.com