
- PREMIUM
- LIVE QUOTES
- INSTITUTION
 Index Options
 State Street
 CME Group
 Nasdaq
 Cboe
Cboe TradingView
 Wall Street Journal
Is It Too Late to Consider RBC After a 30% Surge and Strong Excess Returns?
- If you are wondering whether Royal Bank of Canada is still attractive after such a strong run, or if most of the upside is already reflected in the price, you are not alone. This is exactly what we are going to unpack.
- The stock has climbed 3.7% over the last week, 9.0% over the past month, and is now up around 30.0% over the last year, with a 154.2% gain over five years that points to both solid historical growth and rising expectations.
- Recently, investors have been zeroing in on large, well capitalized Canadian banks like Royal Bank of Canada as a relative safe haven during periods of market volatility. At the same time, ongoing macro themes such as interest rate expectations, regulatory scrutiny on housing exposure, and the broader health of the North American consumer have all fed into shifting views on what the bank might be worth.
- Even with this backdrop, Royal Bank of Canada only scores a 2 out of 6 on our valuation checks. This suggests the market may be paying up in some areas while still underpricing others. Next, we will walk through the usual valuation lenses before finishing with a more rounded way to think about what the stock might be worth.
Royal Bank of Canada scores just 2/6 on our valuation checks. See what other red flags we found in the full valuation breakdown.
Approach 1: Royal Bank of Canada Excess Returns Analysis
The Excess Returns model looks at how effectively Royal Bank of Canada turns shareholder capital into profits above the return investors demand, then projects how long that performance can last.
In this framework, Royal Bank of Canada starts with a Book Value of CA$91.00 per share and an Average Return on Equity of 16.38%. Analysts expect Stable EPS of about CA$16.61 per share, based on forward looking Return on Equity estimates from 11 analysts, and a Stable Book Value of CA$101.40 per share, guided by forecasts from 10 analysts.
The Cost of Equity, what shareholders require as compensation for risk, is estimated at CA$7.35 per share. Royal Bank of Canada is modeled to generate an Excess Return of CA$9.26 per share, meaning earnings comfortably exceed that required return and signal strong value creation.
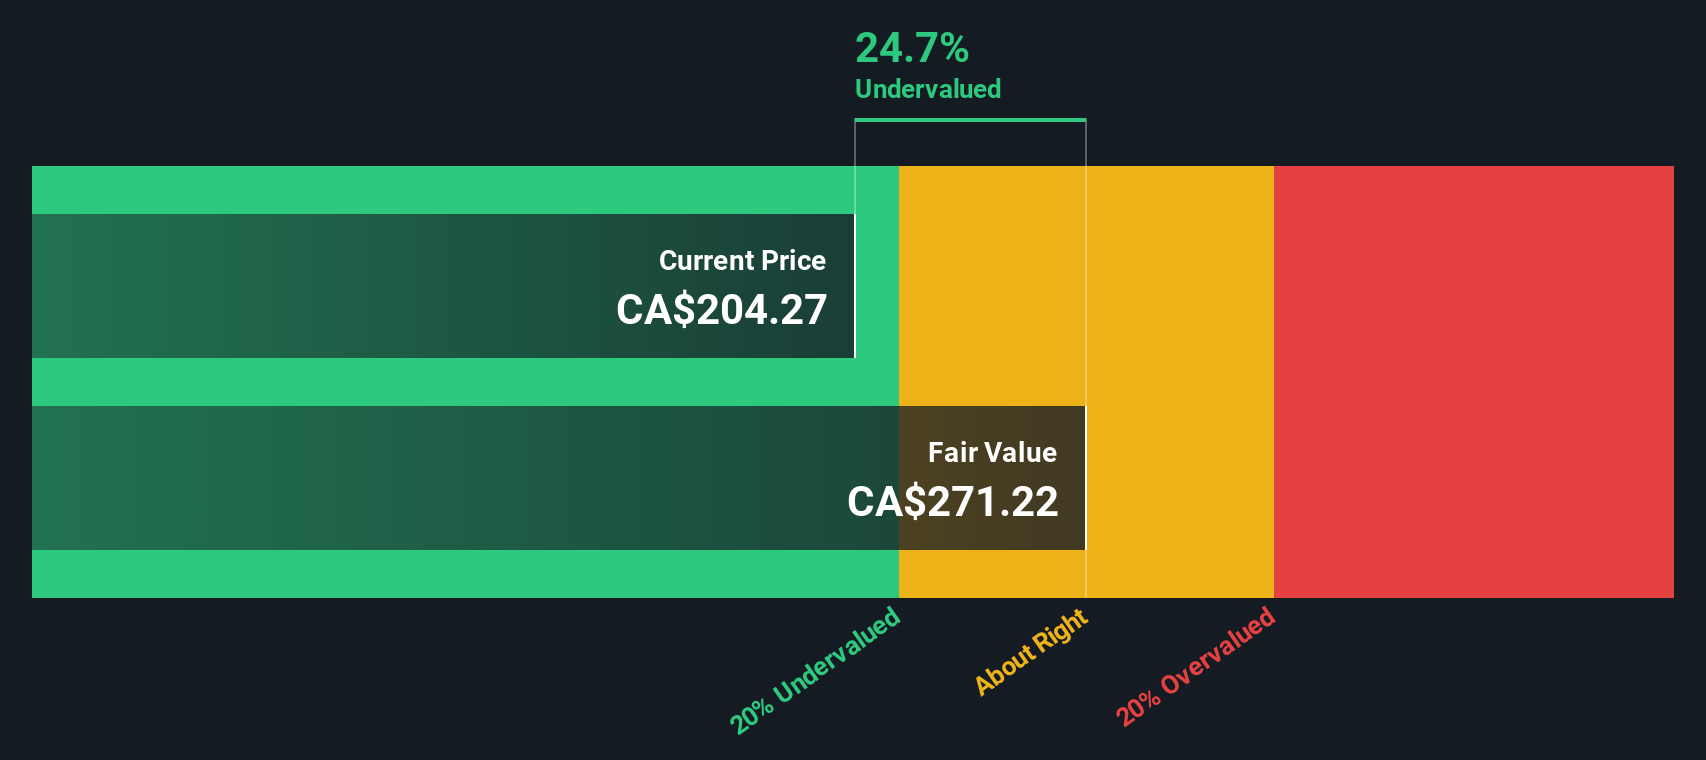
When these excess returns are projected forward and discounted back, the Excess Returns model arrives at an intrinsic value of about CA$307 per share. This implies the stock is roughly 27.1% undervalued versus the current price.
Result: UNDERVALUED
Our Excess Returns analysis suggests Royal Bank of Canada is undervalued by 27.1%. Track this in your watchlist or portfolio, or discover 914 more undervalued stocks based on cash flows.
Approach 2: Royal Bank of Canada Price vs Earnings
For profitable, mature companies like Royal Bank of Canada, the Price to Earnings, or PE, ratio is a practical way to gauge whether investors are paying a reasonable price for each dollar of earnings. A higher PE can be justified when growth is strong and risks are relatively low, while slower growth or elevated risk usually calls for a lower, more conservative multiple.
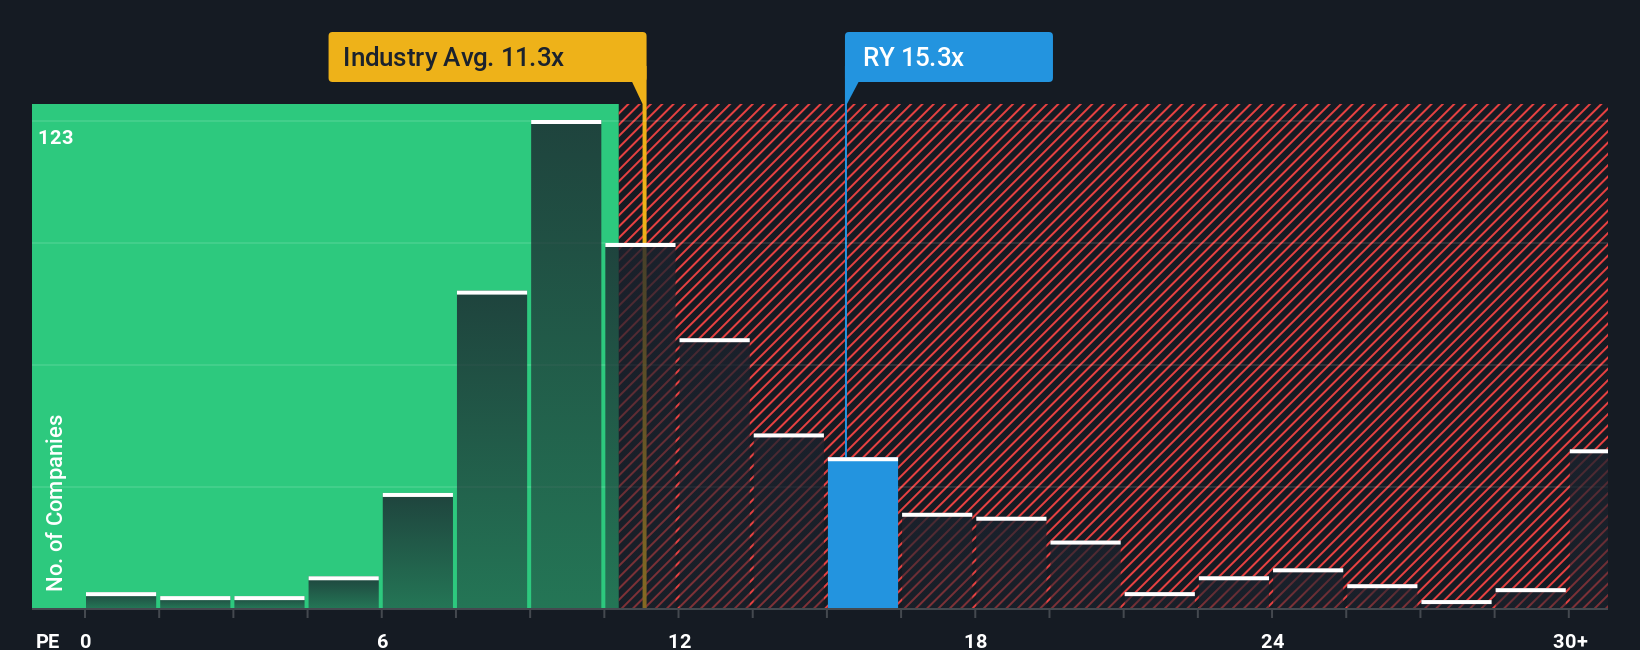
Royal Bank of Canada currently trades on a PE of about 15.8x. That is above the broader Banks industry average of roughly 10.6x and also higher than the 14.2x average for its peer group. This indicates that investors already assign a quality or growth premium to the stock. Simply Wall St’s Fair Ratio framework takes this a step further by estimating what PE the company should trade on given its specific mix of earnings growth prospects, profitability, risk profile, industry positioning and market cap.
On this basis, Royal Bank of Canada’s Fair Ratio comes out at around 14.9x, which is slightly below the current 15.8x. That gap suggests the shares look modestly expensive on earnings and implies the market may be pricing in somewhat more optimism than our fundamentals based model supports.
Result: OVERVALUED
PE ratios tell one story, but what if the real opportunity lies elsewhere? Discover 1442 companies where insiders are betting big on explosive growth.
Upgrade Your Decision Making: Choose your Royal Bank of Canada Narrative
Earlier we mentioned that there is an even better way to understand valuation, so let us introduce you to Narratives, a simple way to connect your view of Royal Bank of Canada’s future to a set of numbers like revenue growth, margins and a fair value estimate, then see how that stacks up against the current share price. On Simply Wall St’s Community page, millions of investors use Narratives to write the story behind their assumptions, link that story to a dynamic forecast and fair value, and then compare Fair Value to today’s Price to decide whether they think it is time to buy, hold or sell. Because Narratives update as new information comes in, for example, earnings, news or changes in analyst forecasts, they stay relevant instead of going stale on your watchlist. For Royal Bank of Canada, one investor might build a bullish Narrative around AI enabled efficiency gains, wealth management expansion and successful integration of HSBC Canada that supports a fair value near the optimistic CA$227 target, while a more cautious investor might emphasize credit cycle risk, housing exposure and slower core growth to arrive closer to the CA$169 bear case.
Do you think there's more to the story for Royal Bank of Canada? Head over to our Community to see what others are saying!

This article by Simply Wall St is general in nature. We provide commentary based on historical data and analyst forecasts only using an unbiased methodology and our articles are not intended to be financial advice. It does not constitute a recommendation to buy or sell any stock, and does not take account of your objectives, or your financial situation. We aim to bring you long-term focused analysis driven by fundamental data. Note that our analysis may not factor in the latest price-sensitive company announcements or qualitative material. Simply Wall St has no position in any stocks mentioned.
Have feedback on this article? Concerned about the content? Get in touch with us directly. Alternatively, email editorial-team@simplywallst.com