
- PREMIUM
- LIVE QUOTES
- INSTITUTION
 Index Options
 State Street
 CME Group
 Nasdaq
 Cboe
Cboe TradingView
 Wall Street Journal
Does Brookfield Asset Management’s Fee Focus Justify Its Current Valuation After Recent Share Weakness?
- If you are wondering whether Brookfield Asset Management is a bargain or a value trap at today's price, you are not alone. This article walks through exactly what the numbers are saying.
- The stock has drifted lately, up just 0.4% over the last week and down 3.0% over 30 days, leaving it about 5.7% lower year to date and roughly 6.4% below where it was a year ago, despite a strong 81.6% gain over three years.
- Those mixed returns come as Brookfield keeps leaning into its asset light, fee focused model and continues to raise fresh capital for infrastructure, renewable power, and private credit strategies. At the same time, shifting expectations for interest rates and risk appetite in private markets have been tugging on valuations across the alternative asset manager space, including Brookfield.
- On our checks, Brookfield scores only 1 out of 6 for being undervalued. We will unpack what that means using DCF-style fair value work, multiples, and peer comparisons, then finish by looking at a more narrative-driven way to judge whether the current price really makes sense.
Brookfield Asset Management scores just 1/6 on our valuation checks. See what other red flags we found in the full valuation breakdown.
Approach 1: Brookfield Asset Management Excess Returns Analysis
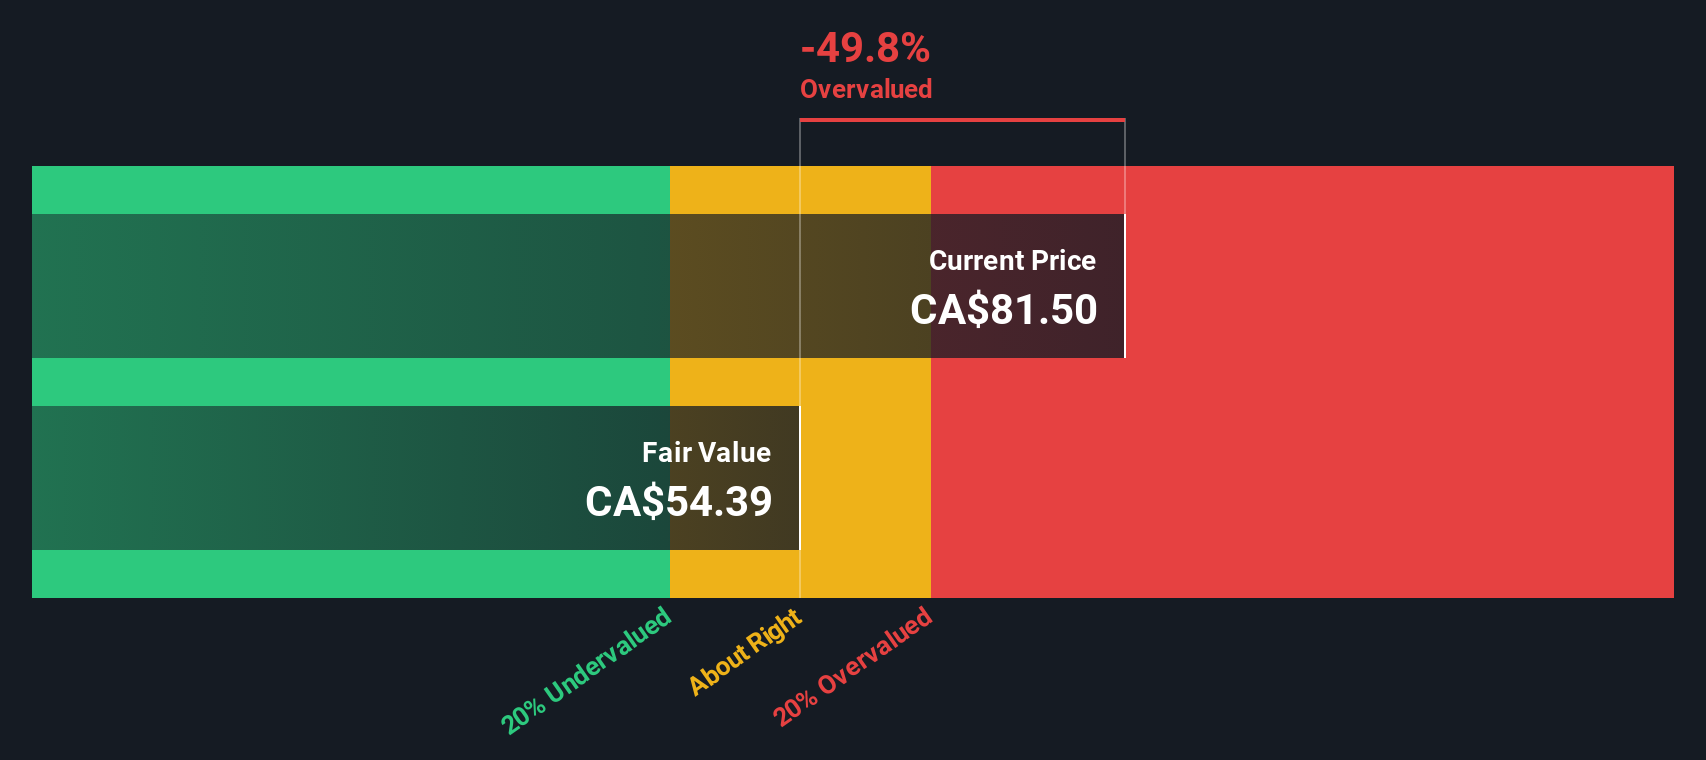
The Excess Returns model looks at how much profit a company can generate above the return that investors require on its equity, then capitalizes that stream of excess profit into an intrinsic value per share.
For Brookfield Asset Management, the model starts with a Book Value of CA$5.25 per share and a Stable EPS estimate of CA$2.25 per share, based on weighted future Return on Equity estimates from 5 analysts. That implies a robust Average Return on Equity of 36.40%, well above the required Cost of Equity of CA$0.47 per share. The difference, an Excess Return of CA$1.77 per share, is then applied to a Stable Book Value of CA$6.17 per share, which is based on future book value estimates from 4 analysts.
Combining these inputs, the Excess Returns valuation produces an intrinsic value of about CA$59.08 per share. With the model indicating the shares are roughly 25.1% above this intrinsic value, Brookfield currently screens as overvalued on this basis.
Result: OVERVALUED
Our Excess Returns analysis suggests Brookfield Asset Management may be overvalued by 25.1%. Discover 913 undervalued stocks or create your own screener to find better value opportunities.
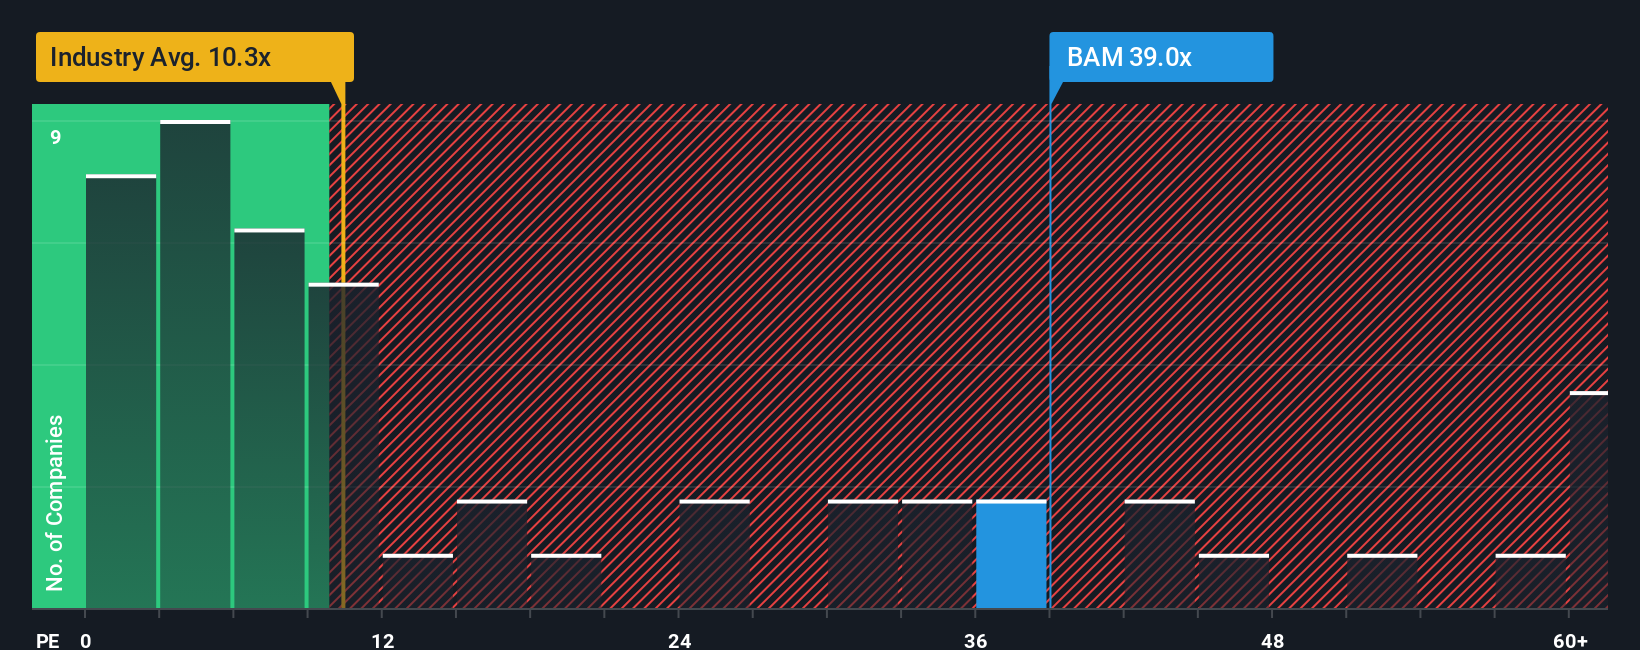
Approach 2: Brookfield Asset Management Price vs Earnings
For a profitable asset manager like Brookfield, the price to earnings, or PE, ratio is a useful lens because it directly links what investors are paying to the earnings power of the business today. In general, faster and more reliable earnings growth, combined with lower perceived risk, justify a higher PE, while slower or bumpier growth and higher risk call for a lower, more cautious multiple.
Brookfield currently trades at about 32.6x earnings, which is far above the Capital Markets industry average of around 8.8x but actually below the peer group average of roughly 49.8x. To move beyond these blunt comparisons, Simply Wall St uses a proprietary Fair Ratio, which estimates what a “normal” PE for Brookfield should be given its earnings growth profile, profitability, industry, market cap and company specific risks. Because it incorporates these fundamentals rather than just lining the stock up against broad industry or peer averages, the Fair Ratio is a more tailored and decision ready benchmark.
On this basis, Brookfield’s Fair Ratio is 24.0x, meaning the current 32.6x PE sits meaningfully higher, pointing to a stock that looks expensive relative to its fundamentals.
Result: OVERVALUED
PE ratios tell one story, but what if the real opportunity lies elsewhere? Discover 1442 companies where insiders are betting big on explosive growth.
Upgrade Your Decision Making: Choose your Brookfield Asset Management Narrative
Earlier we mentioned that there is an even better way to understand valuation, so let us introduce you to Narratives. A Narrative is simply your story about a company, captured in numbers, where you spell out how you think its revenue, earnings and margins will evolve and what that implies for fair value. Instead of stopping at ratios, Narratives connect three layers: the business story you believe in, the financial forecast that flows from that story, and the fair value estimate those forecasts support. On Simply Wall St’s Community page, used by millions of investors, Narratives are an easy, guided tool that lets you plug in your assumptions and instantly see whether Brookfield’s current price looks attractive or stretched versus your Fair Value. As news, earnings, deals or macro shifts arrive, Narratives can be updated quickly so your view stays aligned with the latest information rather than a stale model. For example, one Brookfield Narrative might assume slower fundraising and assign a much lower fair value than another Narrative that expects rapid growth in private credit and infrastructure fee streams.
Do you think there's more to the story for Brookfield Asset Management? Head over to our Community to see what others are saying!
This article by Simply Wall St is general in nature. We provide commentary based on historical data and analyst forecasts only using an unbiased methodology and our articles are not intended to be financial advice. It does not constitute a recommendation to buy or sell any stock, and does not take account of your objectives, or your financial situation. We aim to bring you long-term focused analysis driven by fundamental data. Note that our analysis may not factor in the latest price-sensitive company announcements or qualitative material. Simply Wall St has no position in any stocks mentioned.
Have feedback on this article? Concerned about the content? Get in touch with us directly. Alternatively, email editorial-team@simplywallst.com