
- PREMIUM
- LIVE QUOTES
- INSTITUTION
 Index Options
 State Street
 CME Group
 Nasdaq
 Cboe
Cboe TradingView
 Wall Street Journal
Salesforce (CRM) Q3: Margin Expansion Reinforces Bullish Profitability Narrative
Salesforce (CRM) has kicked off Q3 2026 with total revenue of about $10.3 billion and basic EPS of $2.20, as investors dissect how the latest print fits into the company’s evolving growth story. The company has seen quarterly revenue move from $9.4 billion in Q3 2025 to $10.3 billion in Q3 2026, while basic EPS has stepped up from $1.60 to $2.20 over the same stretch, which points to a business that is converting more of its top line into earnings. With trailing twelve month profits also climbing and net margins edging higher, this set of results puts profitability and operating discipline firmly in focus for shareholders.
See our full analysis for Salesforce.With the headline numbers on the table, the next step is to weigh them against the most common stories investors tell about Salesforce and see which narratives hold up under the latest margin and growth trends.
See what the community is saying about Salesforce
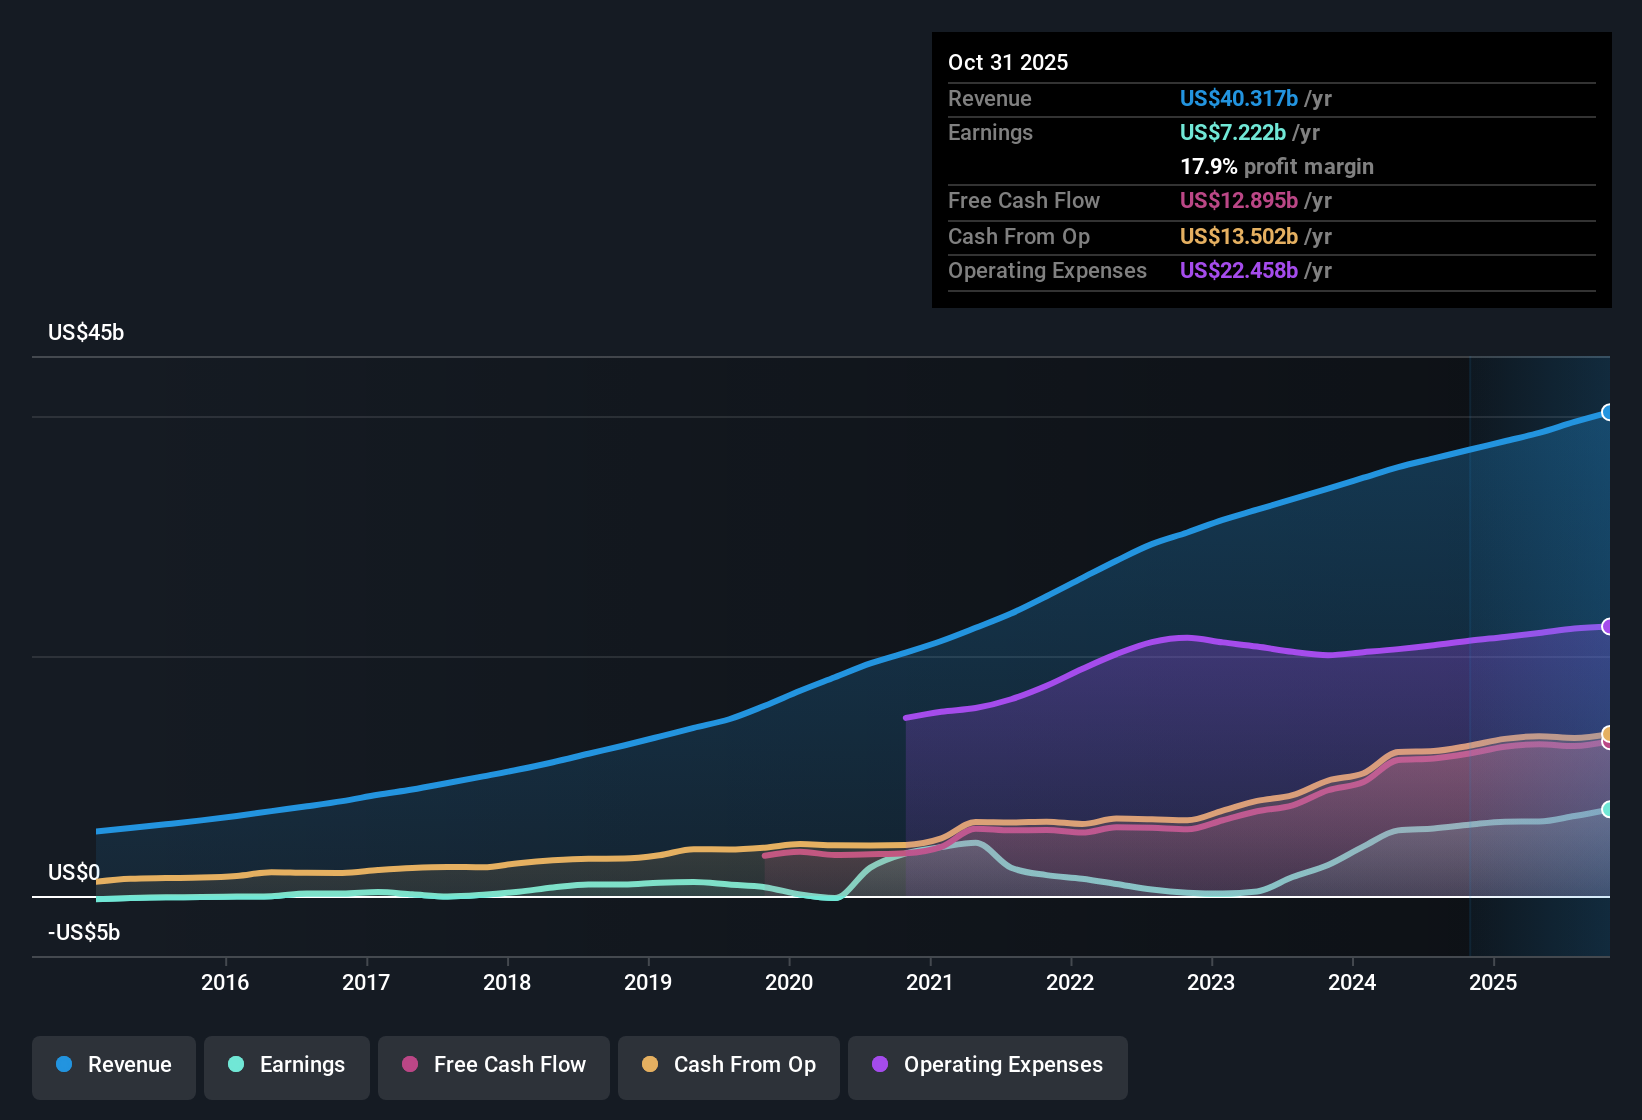
Margins Build On 17.9% Profit Level
- Over the last 12 months, Salesforce generated about $7.2 billion of net income on roughly $40.3 billion of revenue, translating into a 17.9% net margin versus 16.0% a year earlier.
- What stands out for the bullish camp is that this margin lift is arriving alongside solid scale, with trailing earnings up 21.7% year over year and five year earnings growth averaging 27.7% per year, which heavily supports the idea from optimistic investors that AI driven automation and workflow integrations can keep expanding both revenue and margins.
- Those bulls point to triple digit growth in AI and Data Cloud related annual recurring revenue and to larger average contract values, which fit neatly with the rising margin profile and $7.2 billion of trailing profits.
- At the same time, the current 17.9% margin is still below the roughly 19.9% level analysts expect in three years, so the recent improvement leaves room for further upside that would need to materialize to match the most optimistic growth stories.
Earnings Growth Slows Versus Market
- Analysts expect Salesforce’s earnings to grow about 12.7% per year and revenue about 8.9% per year, which are both below the cited US market growth rates of 16.1% for earnings and 10.6% for revenue despite trailing earnings growing 21.7% over the last year.
- Bears focus on this step down from the 27.7% five year earnings growth rate, arguing that as growth converges toward high single digits on the top line, competitive and regulatory pressures could make it harder to sustain the kind of profit expansion that justified a premium multiple in the past.
- Critics highlight the risk that intensifying competition from large software and cloud providers could pressure Salesforce’s pricing and slow its ability to keep revenue growth ahead of the market when forecasts already trail the broader benchmark.
- They also emphasize that a more complex product stack built through acquisitions may increase costs and integration challenges, which would make it tougher to turn an 8.9% revenue growth path into the higher margins and earnings growth that bulls are banking on.
Valuation Sits Between Peers And DCF
- At a share price of $247.46, Salesforce trades at about 32.6 times trailing earnings, slightly above the US software industry average of roughly 31.4 times but below a peer group around 57.6 times, and about 30% below a DCF fair value estimate of $353.73.
- Consensus narrative watchers see an interesting trade off here, because the stock screens as cheaper than many direct peers and below its DCF fair value while still carrying a multiple that is a touch richer than the wider software industry even as future earnings growth is forecast to lag the broader US market.
- Supporters argue that the 17.9% net margin and $7.2 billion trailing net income help justify paying a bit more than the sector, especially if margins move toward the 19.9% level analysts see in three years.
- On the other hand, the combination of slower forecast revenue and earnings growth than the market and a P E that is not clearly discounted versus the industry could limit how quickly the roughly 30% gap to the $353.73 DCF fair value closes if growth delivers only in line with expectations.
Next Steps
To see how these results tie into long-term growth, risks, and valuation, check out the full range of community narratives for Salesforce on Simply Wall St. Add the company to your watchlist or portfolio so you'll be alerted when the story evolves.
See the numbers differently? Use your own lens, explore the data in minutes, and turn that view into a concise narrative: Do it your way.
A good starting point is our analysis highlighting 3 key rewards investors are optimistic about regarding Salesforce.
See What Else Is Out There
Salesforce faces slowing forecast growth versus the wider market and only a modest valuation edge over peers, which could restrain future upside.
If decelerating growth at a premium multiple makes you uneasy, use our stable growth stocks screener (2078 results) to quickly focus on companies delivering steadier, more predictable expansion.
This article by Simply Wall St is general in nature. We provide commentary based on historical data and analyst forecasts only using an unbiased methodology and our articles are not intended to be financial advice. It does not constitute a recommendation to buy or sell any stock, and does not take account of your objectives, or your financial situation. We aim to bring you long-term focused analysis driven by fundamental data. Note that our analysis may not factor in the latest price-sensitive company announcements or qualitative material. Simply Wall St has no position in any stocks mentioned.
Have feedback on this article? Concerned about the content? Get in touch with us directly. Alternatively, email editorial-team@simplywallst.com