
- PREMIUM
- LIVE QUOTES
- INSTITUTION
 Index Options
 State Street
 CME Group
 Nasdaq
 Cboe
Cboe TradingView
 Wall Street Journal
Is Dorchester Minerals a Value Opportunity After a 35% Share Price Slide in 2025?
- If you have been wondering whether Dorchester Minerals is quietly turning into a value opportunity or a value trap, you are not alone. That is exactly what we are going to unpack here.
- The stock has bounced about 6.0% over the last week but is still down roughly 3.8% over the last month and a steep 35.0% year to date, with a 5 year gain of about 225.7% showing just how cyclical sentiment around it can be.
- Recent coverage has focused on how royalty and mineral interests like Dorchester respond when energy markets shift, and what that means for income oriented investors looking for durable cash flows rather than pure growth. This backdrop helps explain why the share price can rerate quickly as the market reassesses long term commodity assumptions and risk.
- Right now Dorchester Minerals scores a 3 out of 6 on our valuation checks, suggesting some metrics flag it as undervalued while others call for caution. Next we will walk through the different valuation approaches, and then finish with a more holistic way of thinking about what the stock is really worth.
Find out why Dorchester Minerals's -24.9% return over the last year is lagging behind its peers.
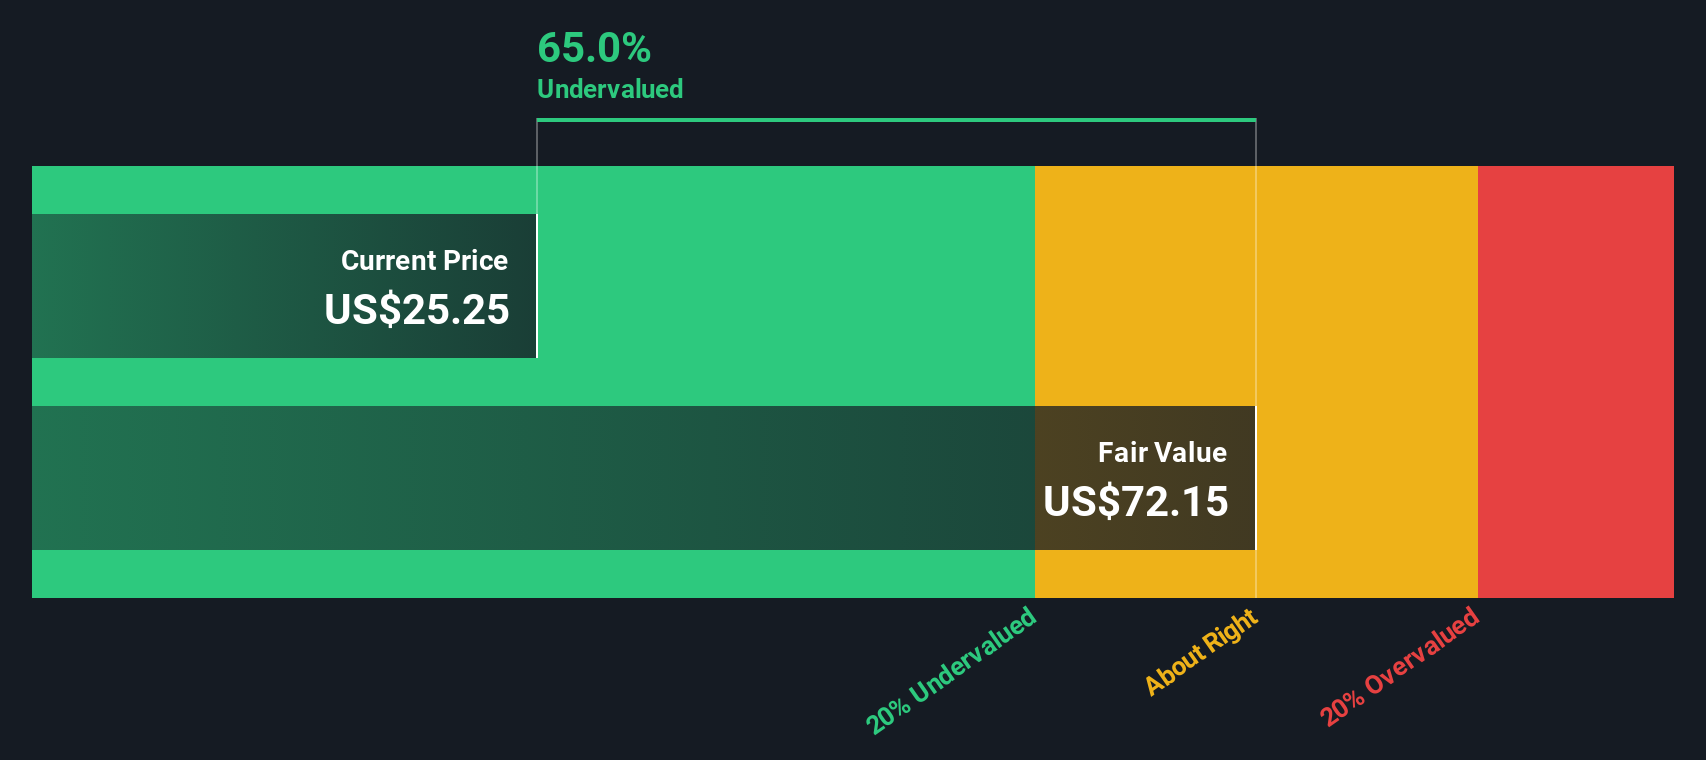
Approach 1: Dorchester Minerals Discounted Cash Flow (DCF) Analysis
A Discounted Cash Flow (DCF) model estimates what a business is worth by projecting its future cash flows and then discounting them back to today in $ terms. For Dorchester Minerals, the model starts with last twelve month Free Cash Flow of about $129.7 million and applies a 2 Stage Free Cash Flow to Equity approach, where near term cash flows are forecast in more detail and later years are extrapolated.
Analysts typically provide visibility for only the next few years, so Simply Wall St extends those estimates using modest growth assumptions. Under this framework, Dorchester’s Free Cash Flow is projected to be around $158.4 million in 2035, with incremental growth each year between now and then. When all those projected cash flows are discounted back to today, the model arrives at an intrinsic value of roughly $67.09 per share.
Compared with the current market price, this implies the stock is about 66.4% undervalued. This suggests investors are heavily discounting the durability of those future cash flows.
Result: UNDERVALUED
Our Discounted Cash Flow (DCF) analysis suggests Dorchester Minerals is undervalued by 66.4%. Track this in your watchlist or portfolio, or discover 914 more undervalued stocks based on cash flows.
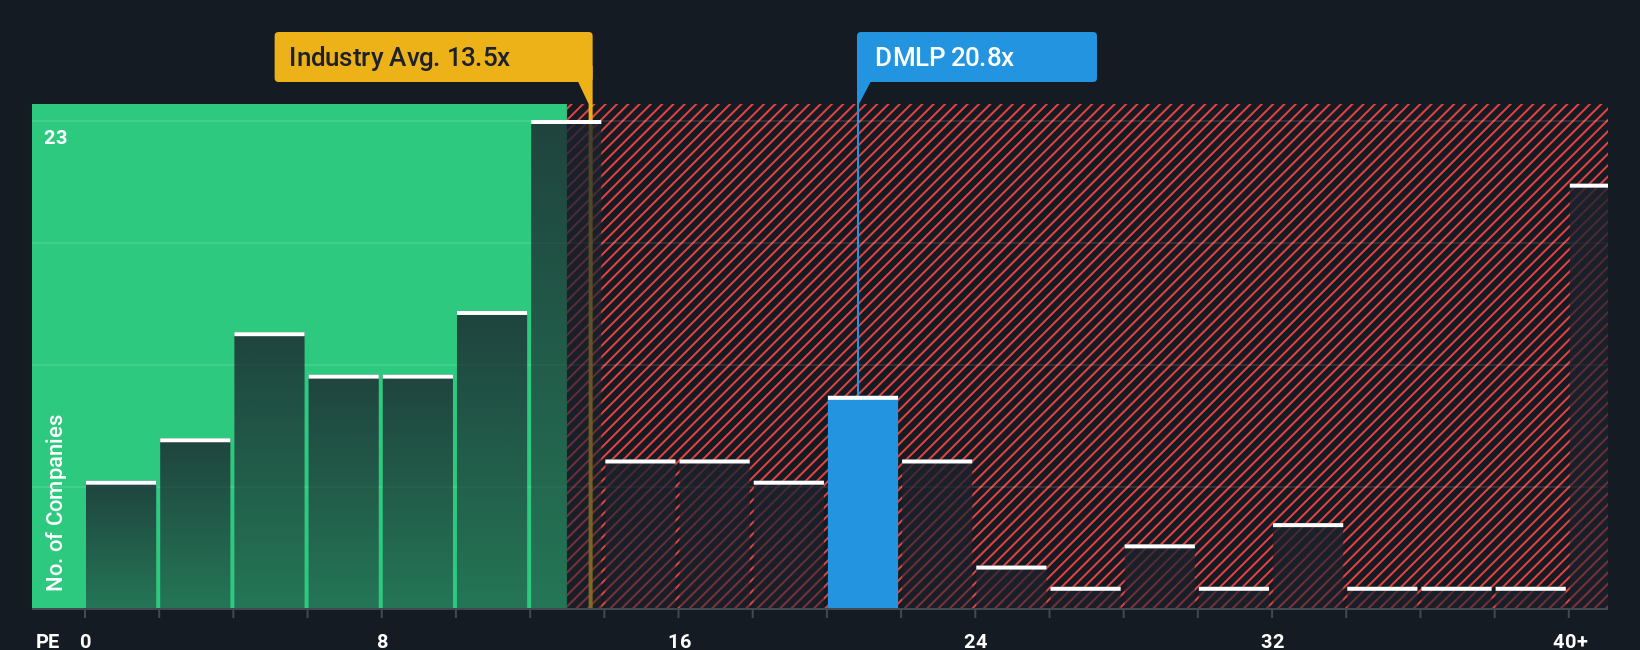
Approach 2: Dorchester Minerals Price vs Earnings
For profitable, established businesses like Dorchester Minerals, the Price to Earnings ratio is a practical way to gauge valuation because it directly links what investors pay for each share to the earnings the company is currently generating. In general, higher growth prospects and lower perceived risk justify a higher PE multiple, while slower growth or higher uncertainty should pull that multiple down.
Dorchester Minerals currently trades on a PE of about 20.4x. That sits above the broader Oil and Gas industry average of roughly 13.8x, but below the peer group average near 27.6x, which implies the market sees Dorchester as higher quality than the typical producer, yet not as aggressively priced as some royalty peers. Simply Wall St goes a step further by estimating a Fair Ratio, a proprietary view of what Dorchester’s PE should be after accounting for its earnings growth outlook, margins, risk profile, industry positioning and market cap.
Because this Fair Ratio is tailored to Dorchester’s specific fundamentals rather than broad sector averages, it offers a sharper lens on value. In this case, the Fair Ratio suggests that, relative to its earnings power and risk, Dorchester’s current PE leaves the shares trading at a discount.
Result: UNDERVALUED
PE ratios tell one story, but what if the real opportunity lies elsewhere? Discover 1442 companies where insiders are betting big on explosive growth.
Upgrade Your Decision Making: Choose your Dorchester Minerals Narrative
Earlier we mentioned that there is an even better way to understand valuation, so let us introduce you to Narratives, a simple framework that lets you attach a story, your assumptions about future revenue, earnings, margins and risk, to the numbers that ultimately drive a fair value estimate.
A Narrative connects three things: how you think a business will evolve, the financial forecast that follows from that story, and the fair value that drops out of those forecasts, so you can clearly see whether the current price lines up with your expectations.
On Simply Wall St, Narratives are built directly into the Community page, where millions of investors use them as an easy, accessible tool to compare their own fair value to the current price and decide whether a stock looks like a buy, hold or sell.
Because Narratives on the platform are updated dynamically as new information arrives, for example, a Dorchester Minerals bull might set a higher fair value driven by stronger long term royalty volumes and firmer commodity prices, while a bear might choose a much lower fair value based on weaker energy demand and rising discount rates. Both of those views will automatically refresh when fresh data comes in.
Do you think there's more to the story for Dorchester Minerals? Head over to our Community to see what others are saying!

This article by Simply Wall St is general in nature. We provide commentary based on historical data and analyst forecasts only using an unbiased methodology and our articles are not intended to be financial advice. It does not constitute a recommendation to buy or sell any stock, and does not take account of your objectives, or your financial situation. We aim to bring you long-term focused analysis driven by fundamental data. Note that our analysis may not factor in the latest price-sensitive company announcements or qualitative material. Simply Wall St has no position in any stocks mentioned.
Have feedback on this article? Concerned about the content? Get in touch with us directly. Alternatively, email editorial-team@simplywallst.com