
- PREMIUM
- LIVE QUOTES
- INSTITUTION
 Index Options
 State Street
 CME Group
 Nasdaq
 Cboe
Cboe TradingView
 Wall Street Journal
Has Sampo Oyj’s 105% Five Year Surge Already Priced In Its Insurance Focus?
- If you are wondering whether Sampo Oyj is still good value after its strong run, or if you are late to the party, this breakdown will help you separate durable fundamentals from market hype.
- The stock is up 25.4% year to date and 24.9% over the last year, with a 105.6% gain over five years. However, it has eased back 2.1% in the last week and is only slightly higher over the past month at 1.7%.
- Recent moves have been driven by the market continuing to price Sampo as a focused Nordic insurance group after its full exit from legacy banking exposure, and by ongoing portfolio tidying that investors see as sharpening its earnings profile. At the same time, sector wide shifts in interest rate expectations have nudged sentiment for European insurers, affecting how investors think about future investment returns and capital returns.
- On our framework Sampo scores a 3 out of 6 for undervaluation checks, which suggests some value support but not a clear bargain. Next we will walk through the different valuation approaches investors are using today and then finish with a more holistic way to judge whether the current price makes sense.
Approach 1: Sampo Oyj Excess Returns Analysis
The Excess Returns model looks at how much profit Sampo generates above the minimum return investors require on its equity capital, then projects and values those surplus profits over time. It is a way of asking whether management is creating value on each euro of book value, rather than just how fast earnings are growing.
For Sampo, the model uses a Book Value of €2.86 per share and a Stable EPS of €0.59 per share, based on weighted future Return on Equity estimates from 9 analysts. With an Average Return on Equity of 19.90% and a Cost of Equity equivalent to €0.17 per share, Sampo is expected to generate an Excess Return of €0.42 per share, indicating that projected profitability comfortably clears its required return hurdle.
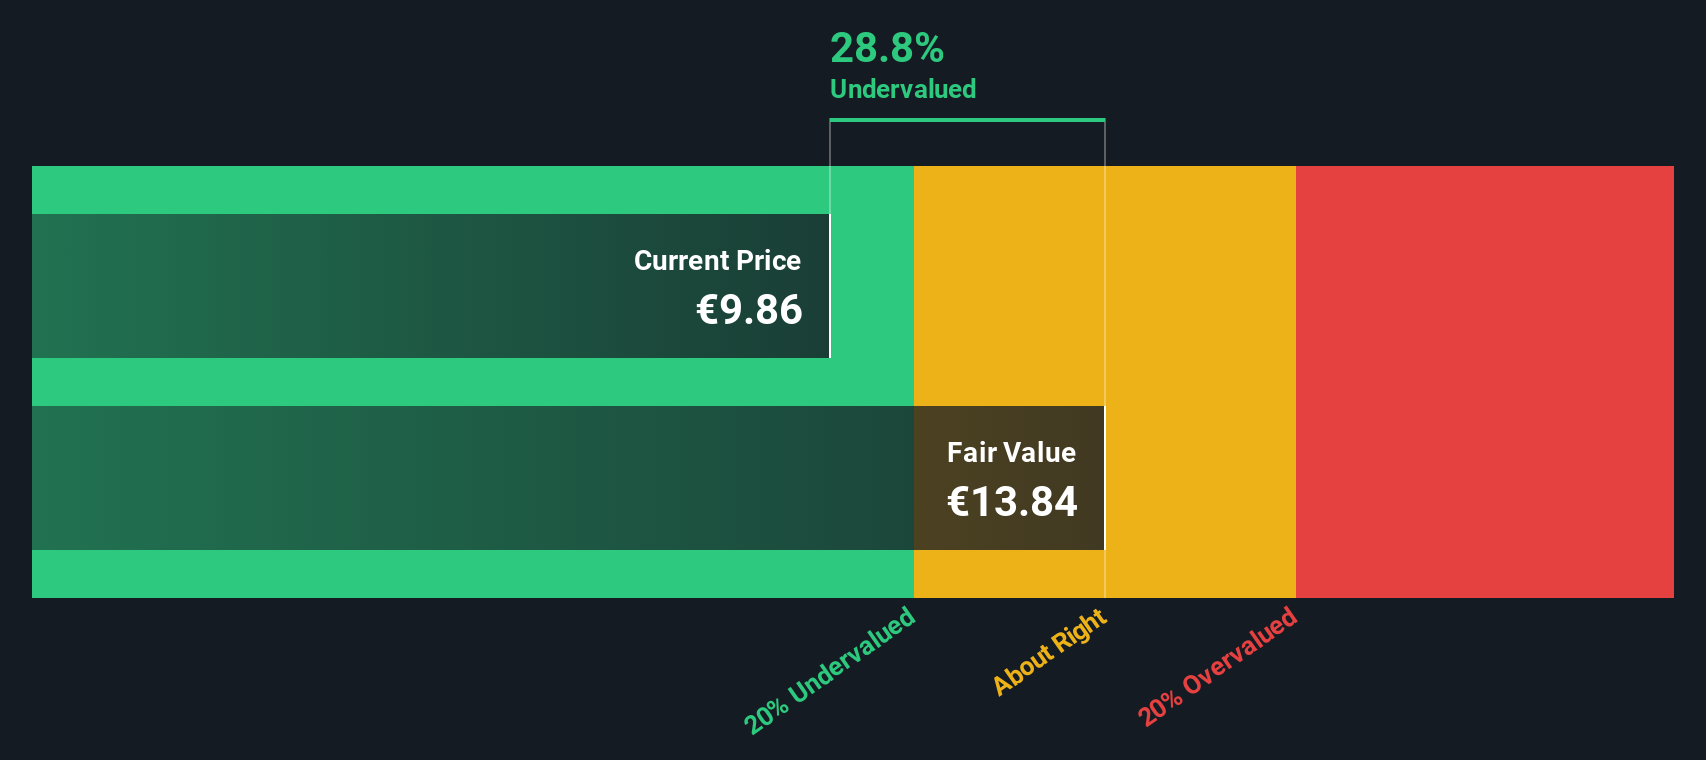
The Stable Book Value is estimated at €2.98 per share, based on forecasts from 4 analysts, supporting a view that Sampo can sustain value accretive growth. Under this Excess Returns framework, the intrinsic value comes out at about €14.47 per share, implying the stock is roughly 31.2% undervalued versus its current market price.
Result: UNDERVALUED
Our Excess Returns analysis suggests Sampo Oyj is undervalued by 31.2%. Track this in your watchlist or portfolio, or discover 910 more undervalued stocks based on cash flows.
Approach 2: Sampo Oyj Price vs Earnings
For a consistently profitable insurer like Sampo, the Price to Earnings ratio is a practical way to judge valuation because it ties the share price directly to the profits each share is generating today. In general, faster growth and lower perceived risk justify a higher PE multiple, while slower growth or higher uncertainty usually warrant a lower one.
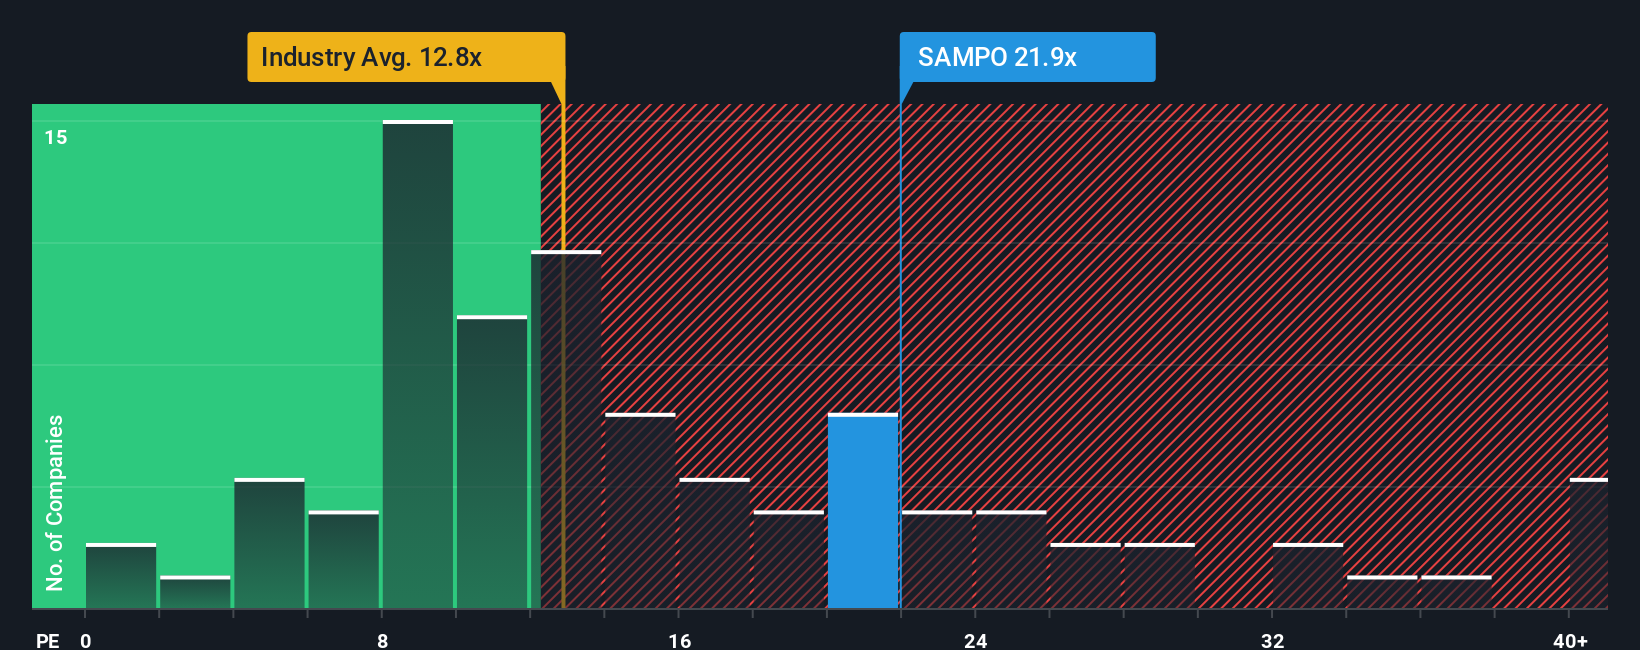
Sampo currently trades on a PE of 16.19x, which is above both the Insurance industry average of 11.55x and the peer group average of 9.95x. On the surface that premium might look stretched, but it does not tell the whole story. Simply Wall St’s Fair Ratio of 18.54x is a more nuanced view of what Sampo’s PE should be, based on its earnings growth outlook, profitability, risk profile, market cap and industry positioning.
Because the Fair Ratio explicitly incorporates these fundamentals, it is a more tailored benchmark than comparing Sampo to a broad industry or a generic peer set that may differ in quality or risk. With the current PE of 16.19x sitting below the Fair Ratio of 18.54x, the multiple-based view points to the shares still being modestly undervalued.
Result: UNDERVALUED
PE ratios tell one story, but what if the real opportunity lies elsewhere? Discover 1442 companies where insiders are betting big on explosive growth.
Upgrade Your Decision Making: Choose your Sampo Oyj Narrative
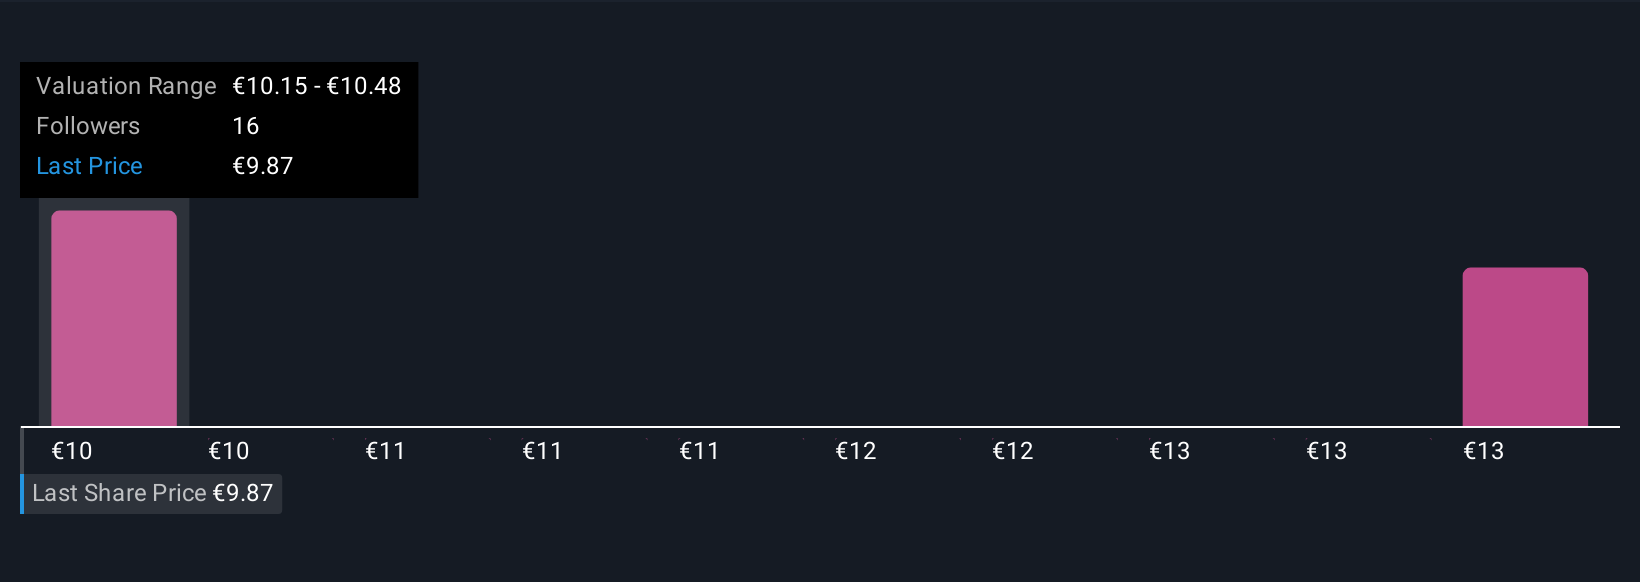
Earlier we mentioned that there is an even better way to understand valuation. Let us introduce you to Narratives: a simple way to turn your view of Sampo Oyj into a clear story that links the company’s strategy and risks to a concrete forecast for revenues, earnings and margins, and then to a Fair Value you can compare with today’s share price. All of this is available within an easy to use tool on Simply Wall St’s Community page that millions of investors already use to help decide when to buy or sell. Each Narrative automatically updates as new news or earnings arrive. For Sampo, one investor might build a bullish Narrative that leans into digital efficiency gains, rising climate related demand and a higher long term margin profile that justifies a Fair Value closer to the top of the current analyst range around €11.50. A more cautious investor could create a bearish Narrative that stresses regional concentration, competitive pressure and thinner margins that pull Fair Value toward the low end near €8.00. This allows you to see exactly how different assumptions about the same business lead to different, but fully transparent, valuations.
Do you think there's more to the story for Sampo Oyj? Head over to our Community to see what others are saying!
This article by Simply Wall St is general in nature. We provide commentary based on historical data and analyst forecasts only using an unbiased methodology and our articles are not intended to be financial advice. It does not constitute a recommendation to buy or sell any stock, and does not take account of your objectives, or your financial situation. We aim to bring you long-term focused analysis driven by fundamental data. Note that our analysis may not factor in the latest price-sensitive company announcements or qualitative material. Simply Wall St has no position in any stocks mentioned.
Have feedback on this article? Concerned about the content? Get in touch with us directly. Alternatively, email editorial-team@simplywallst.com