
- PREMIUM
- LIVE QUOTES
- INSTITUTION
 Index Options
 State Street
 CME Group
 Nasdaq
 Cboe
Cboe TradingView
 Wall Street Journal
Does Ericsson’s 5G Rollout Justify Its Current Valuation After Recent Share Price Swings?
- If you are wondering whether Telefonaktiebolaget LM Ericsson is quietly trading below what it is really worth, you are not alone, and that is exactly what we are going to unpack here.
- Despite a modest 2.0% gain over the last year, the stock has been choppy in the short term, slipping 1.0% over the past week and 4.8% over the last month, which can hint at shifting sentiment rather than a clear change in long term prospects.
- Recent headlines have centered on Ericsson's ongoing 5G network rollouts and strategic partnerships with major carriers, reinforcing its role at the core of global telecom infrastructure. At the same time, market debate around competition, geopolitical exposure, and capital allocation has added noise, which can create mispricings for long term investors willing to look past the headlines.
- Right now, Simply Wall St's valuation checks give Ericsson a solid 5/6 value score, suggesting the market may be underestimating it. We will walk through those valuation lenses next, before finishing with a more holistic way to think about what the stock is really worth.
Approach 1: Telefonaktiebolaget LM Ericsson Discounted Cash Flow (DCF) Analysis
A Discounted Cash Flow model takes the cash Telefonaktiebolaget LM Ericsson is expected to generate in the future and discounts those projections back into today’s money to estimate what the business is worth now.
Ericsson generated roughly SEK 29.7 billion in free cash flow over the last twelve months. Analysts and Simply Wall St’s two stage Free Cash Flow to Equity model project that free cash flow will remain robust, with estimates around SEK 23.2 billion in 2026 and extrapolated figures of about SEK 24.6 billion by 2029 and SEK 24.6 billion by 2035. These longer term forecasts beyond the analyst window are modeled by Simply Wall St rather than being direct analyst estimates.
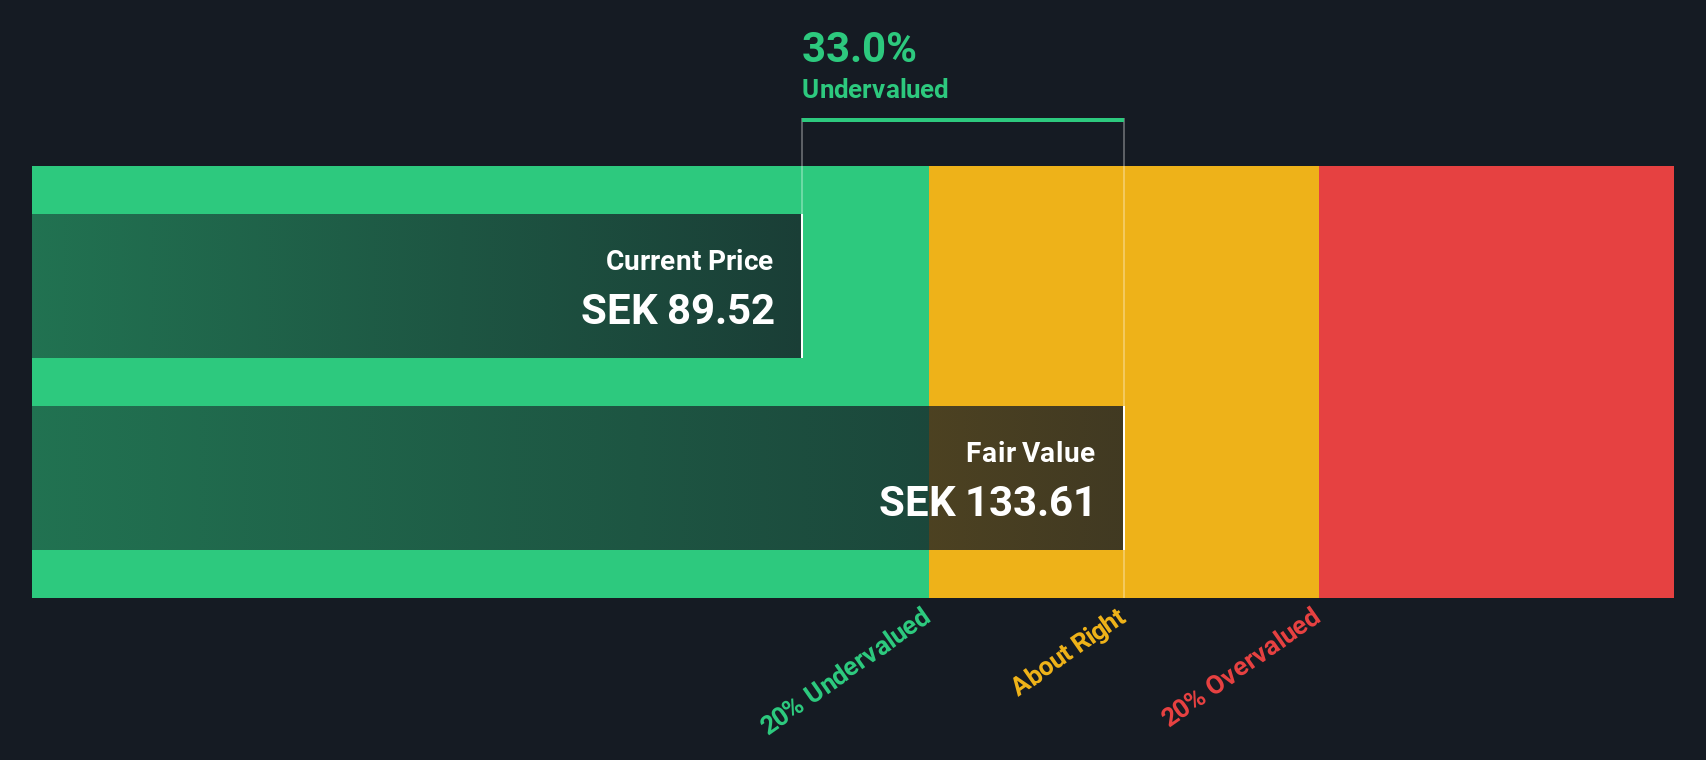
When all those future SEK cash flows are discounted back, the model arrives at an intrinsic value of about SEK 139.72 per share. Compared with the current market price, this suggests the shares trade at a 35.2% discount, indicating potential undervaluation if the cash flow path broadly aligns with these projections.
Result: UNDERVALUED
Our Discounted Cash Flow (DCF) analysis suggests Telefonaktiebolaget LM Ericsson is undervalued by 35.2%. Track this in your watchlist or portfolio, or discover 908 more undervalued stocks based on cash flows.
Approach 2: Telefonaktiebolaget LM Ericsson Price vs Earnings
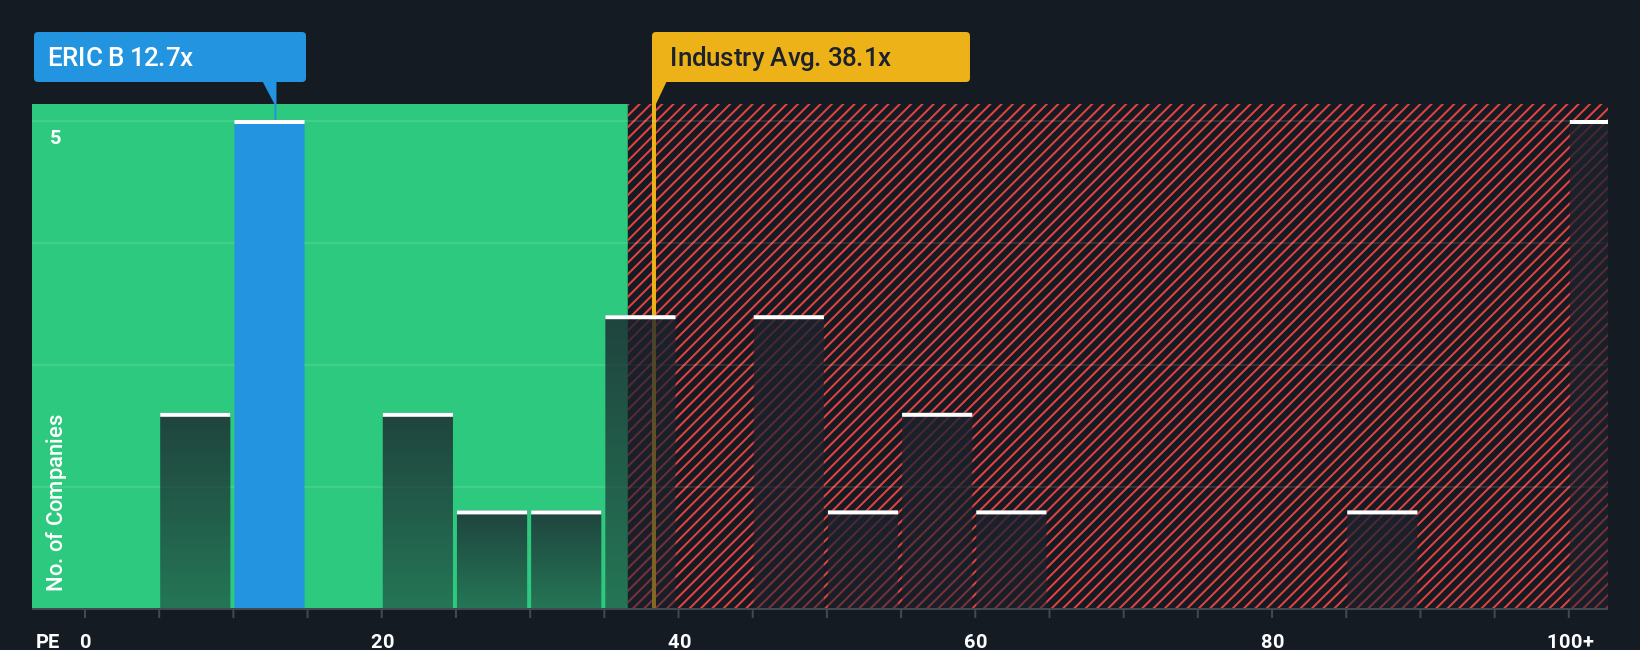
For profitable businesses like Telefonaktiebolaget LM Ericsson, the price to earnings, or PE, ratio is a useful way to gauge how much investors are paying for each unit of current earnings. In general, faster growth and lower perceived risk justify a higher PE, while slower growth or higher uncertainty usually warrant a lower multiple.
Ericsson currently trades on about 12.2x earnings, which is well below both the Communications industry average of roughly 34.8x and a broader peer average of around 42.3x. On the surface, that big discount might suggest the market has fairly muted expectations for its future growth or is pricing in elevated risk.
Simply Wall St’s Fair Ratio framework takes this a step further by estimating what PE Ericsson should trade on, given its own earnings growth profile, margins, risk factors, industry, and market cap. For Ericsson, that Fair Ratio sits near 22.5x. This is more tailored than a simple comparison to peers or the sector because it adjusts for company specific fundamentals rather than assuming all firms deserve the same multiple. Since 22.5x is materially above the current 12.2x, this lens points to the stock being undervalued on an earnings basis.
Result: UNDERVALUED
PE ratios tell one story, but what if the real opportunity lies elsewhere? Discover 1442 companies where insiders are betting big on explosive growth.
Upgrade Your Decision Making: Choose your Telefonaktiebolaget LM Ericsson Narrative
Earlier we mentioned that there is an even better way to understand valuation, so let us introduce you to Narratives, which are simple stories you build around a company that connect your view of its future revenue, earnings and margins to a concrete fair value estimate. A Narrative links what you believe is happening in Ericsson’s business, such as 5G adoption, AI driven demand or geopolitical risk, to a financial forecast, and then to what you think the shares are actually worth, so your investment decisions are grounded in both story and numbers. On Simply Wall St’s Community page, which is used by millions of investors, Narratives are an easy and accessible tool that help you decide when to buy or sell by constantly comparing your Fair Value to the current Price, and they automatically update as new news, earnings or guidance come in. For example, one Ericsson Narrative might lean bullish and arrive at a fair value near SEK 100, while a more cautious view might sit closer to SEK 56, and the platform lets you see, track and refine which story you agree with.
Do you think there's more to the story for Telefonaktiebolaget LM Ericsson? Head over to our Community to see what others are saying!
This article by Simply Wall St is general in nature. We provide commentary based on historical data and analyst forecasts only using an unbiased methodology and our articles are not intended to be financial advice. It does not constitute a recommendation to buy or sell any stock, and does not take account of your objectives, or your financial situation. We aim to bring you long-term focused analysis driven by fundamental data. Note that our analysis may not factor in the latest price-sensitive company announcements or qualitative material. Simply Wall St has no position in any stocks mentioned.
Have feedback on this article? Concerned about the content? Get in touch with us directly. Alternatively, email editorial-team@simplywallst.com