
- PREMIUM
- LIVE QUOTES
- INSTITUTION
 Index Options
 State Street
 CME Group
 Nasdaq
 Cboe
Cboe TradingView
 Wall Street Journal
Minerals 260 (ASX:MI6): Assessing Valuation After Doubling Bullabulling Gold Resource and Gibraltar Milestone
Minerals 260 (ASX:MI6) has announced a major milestone at its Bullabulling project, doubling the contained gold resource to 4.5 million ounces. This upgrade includes new extensions confirmed by drilling as well as a maiden resource at Gibraltar.
See our latest analysis for Minerals 260.
The resource upgrade has energized Minerals 260’s share price, which has soared 221.74% year-to-date and 155.17% over the past 90 days, reflecting growing investor confidence in the company’s project milestones and future growth prospects. However, while momentum is strong in the short term, Minerals 260’s three-year total shareholder return still lags behind, serving as a reminder that recent gains are building from a lower base.
If projects in gold exploration catch your interest, it could be the perfect time to broaden your investing horizons and discover fast growing stocks with high insider ownership
Given this dramatic re-rating for Minerals 260, the key question is whether investors are catching an early wave or if the stock’s new valuation already reflects all the expected growth. Could there still be a buying opportunity, or is future upside already priced in?
Price-to-Book of 3.6x: Is it justified?
Minerals 260 is trading at a price-to-book ratio of 3.6x, which means investors are currently paying $3.60 for every $1 of net assets on the balance sheet. With shares closing at A$0.37, this multiple signals the stock is valued at a premium in comparison to select benchmarks.
The price-to-book ratio is a classic indicator for asset-heavy businesses like mining companies, as it compares a company’s market value to its book value. In this context, it helps gauge whether the market’s optimism about future gold discoveries and extensions is already priced in.
Compared to the Australian Metals and Mining industry average of 2.3x, Minerals 260 appears relatively expensive. However, when compared with a peer average of 8.4x, it could still be seen as reasonably valued. Whether this premium is justified will likely depend on how confident investors are in future project milestones translating into tangible returns.
See what the numbers say about this price — find out in our valuation breakdown.
Result: Price-to-Book of 3.6x (OVERVALUED)
However, weak revenue visibility and ongoing net losses could limit Minerals 260's ability to sustain its current momentum if project milestones disappoint.
Find out about the key risks to this Minerals 260 narrative.
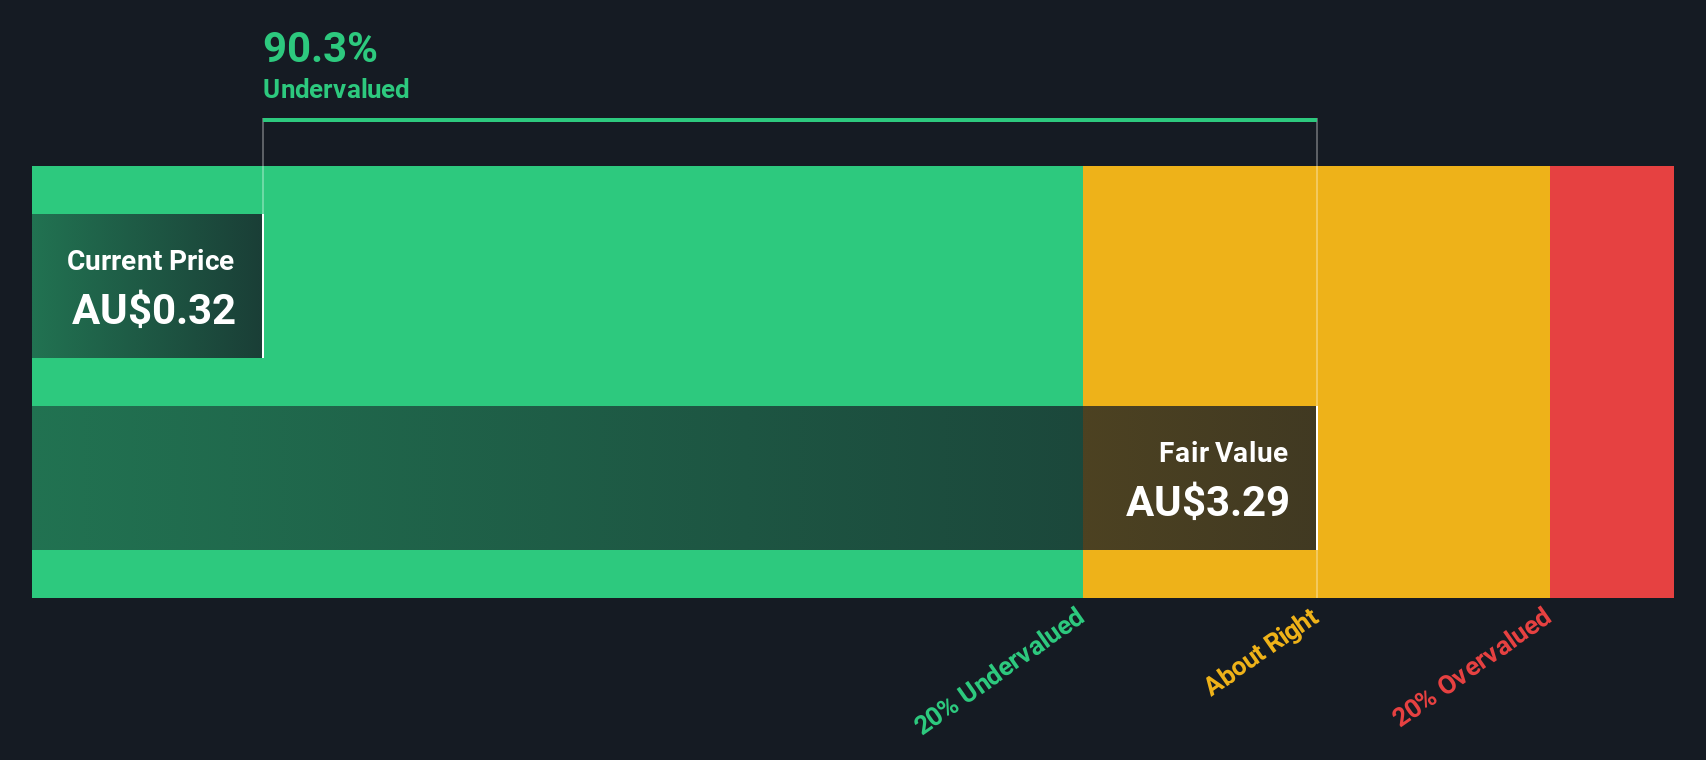
Another View: Deep Discount on Intrinsic Value?
While the price-to-book ratio implies a premium, our DCF model presents a starkly different picture. According to the SWS DCF model, Minerals 260 is trading significantly below its estimated fair value of A$2.87, representing an 87% discount. Could the market be overlooking the company’s long-term growth potential?
Look into how the SWS DCF model arrives at its fair value.
Simply Wall St performs a discounted cash flow (DCF) on every stock in the world every day (check out Minerals 260 for example). We show the entire calculation in full. You can track the result in your watchlist or portfolio and be alerted when this changes, or use our stock screener to discover 928 undervalued stocks based on their cash flows. If you save a screener we even alert you when new companies match - so you never miss a potential opportunity.
Build Your Own Minerals 260 Narrative
If you have a different perspective or want to take control of your own research, you can easily create a custom narrative based on the data in just a few minutes. Do it your way
A great starting point for your Minerals 260 research is our analysis highlighting 2 key rewards and 2 important warning signs that could impact your investment decision.
Looking for more investment ideas?
Don’t leave your next opportunity on the table. Expand your strategy with handpicked stocks tailored for different market trends using the Simply Wall Street Screener.
- Maximize yield potential by checking out these 14 dividend stocks with yields > 3% offering strong dividend payouts with consistent returns.
- Tap into breakthroughs and future tech by evaluating these 25 AI penny stocks making waves in the artificial intelligence sector.
- Secure your edge in tomorrow’s tech race by researching these 27 quantum computing stocks propelling quantum computing innovation.
This article by Simply Wall St is general in nature. We provide commentary based on historical data and analyst forecasts only using an unbiased methodology and our articles are not intended to be financial advice. It does not constitute a recommendation to buy or sell any stock, and does not take account of your objectives, or your financial situation. We aim to bring you long-term focused analysis driven by fundamental data. Note that our analysis may not factor in the latest price-sensitive company announcements or qualitative material. Simply Wall St has no position in any stocks mentioned.
Have feedback on this article? Concerned about the content? Get in touch with us directly. Alternatively, email editorial-team@simplywallst.com